Graph of Future Development of Calligraphy – Revenue Projections and Expectations
RJ0600008_18
- Last Update 06/23/2025
- File Size 0.7MB
- # of Slides 2
- File Format PPTX
- Slide Ratio 16:9
- Color
Keywords
- #Content-Based Slides
- #Design-Based Slides
- #Business Strategy
- #Technical Approach
- #Graph
- #Financial Outlook & Expected Impact
- #Achievements
- #Future Development Roadmap
- #Column
- #Segmented Column
- #16:9
- #stacked bar chart PowerPoint
- #multi-series data visualization slide
- #revenue comparison template
- #financial forecast slide
- #how to create stacked bar chart in PowerPoint
About the Product
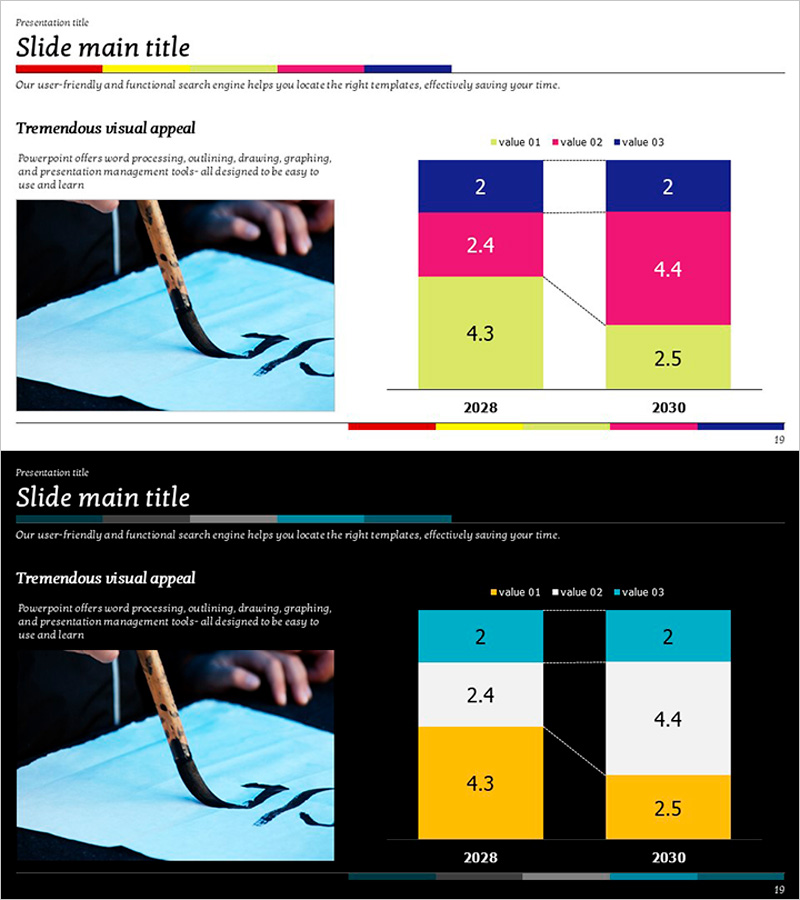
A stacked bar chart PowerPoint slide comparing revenue projections for 2028 and 2030 across three data series. The design uses a dark blue, magenta, and lime green color scheme to clearly distinguish each component and visualize year-over-year changes. Two slide layouts are included—one with a light background and one with a dark background—allowing you to choose the style that best suits your presentation environment. Ideal for business performance analysis, financial forecasting, marketing reports, and investment presentations. All data fields are fully editable for immediate use.
Usage Points
-
Main Usage
Visualize multi-series data and composition ratios across time periods. Ideal for business performance analysis, financial forecasting, marketing ROI reports, revenue projections, and comparative data presentations requiring clear segment breakdown.
-
How to Use
Edit the numerical values in each bar segment to match your data. Update the legend labels (value 01, 02, 03) to reflect your categories, and modify the year labels as needed. The light background version works well for printed materials, while the dark background is optimized for projector presentations.
-
Recommended For
Finance and accounting teams, marketing departments, executive reports, quarterly and annual performance reviews, investor presentations (IR), business plan financial sections, consulting reports, and academic presentations.
-
Slide Structure
Two-slide set. Each slide features two stacked bars (2028 and 2030) with three color-coded segments (dark blue, magenta, lime green) representing different data series. Dotted connector lines highlight key data points, and a legend at the bottom identifies each series. 16:9 aspect ratio, fully editable PPTX format.
Related Products
-

Business Promotion Strategy PowerPoint Template
#Business Strategy #Technical Approach #Market and Competitor Analysis
-

Business Performance Analysis Graph – Vertical Bars
#Business Strategy #Graph #Financial Outlook & Expected Impact
-

Travel Competitor Analysis Vertical Bar Graph – Business Strategy
#Business Strategy #Graph #Financial Outlook & Expected Impact
-

Real Estate Market Trends Chart – Data Analysis and Performance
#Business Strategy #Market and Competitor Analysis #Graph
