Sales and Profit Table – Visualizing Financial Performance
RJ0300084_12
- Last Update 05/12/2025
- File Size 0.1MB
- # of Slides 2
- File Format PPTX
- Slide Ratio 16:9
- Color
Keywords
- #Content-Based Slides
- #Design-Based Slides
- #Financial Plans and Performance
- #Diagram
- #Other
- #Income Statement
- #Sales and Revenue
- #Table
- #Standard Table
- #Silhouette
- #16:9
- #table slide PowerPoint
- #financial data comparison template
- #sales and profit chart
- #income statement PowerPoint slide
- #financial performance presentation template
About the Product
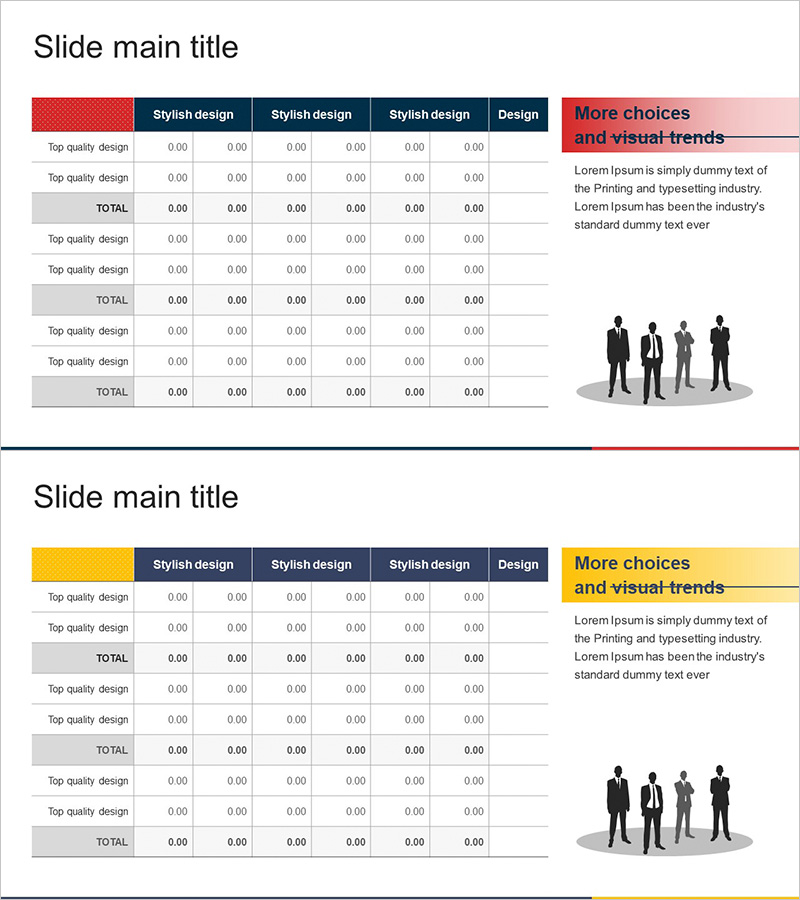
A table-formatted PowerPoint slide designed to present sales and profit data with clear visual hierarchy. Features red and yellow accent headers paired with gray divider lines to organize financial information effectively. The 2-slide set enables side-by-side comparison of departmental or period-based performance metrics, making it ideal for financial reports and quarterly earnings presentations. Compatible with all devices in 16:9 widescreen PPTX format, ready for immediate customization.
Usage Points
-
Main Usage
Present quarterly financial results, departmental performance metrics, and profit-and-loss analysis in structured table format. Strengthens credibility of financial data during investor presentations, board meetings, and executive briefings by displaying key figures in organized, comparable rows and columns.
-
How to Use
Input different fiscal periods or departmental data into slides 1 and 2 for comparative analysis. Maintain header colors (red and yellow) while editing only the numerical values to preserve brand consistency. Table structure remains clear when printed or converted to PDF format.
-
Recommended For
CFOs, finance managers, and executives presenting quarterly earnings, investor relations meetings, internal management reviews, and audit compliance documentation. Suitable for any stakeholder requiring transparent financial performance visualization.
-
Slide Structure
2-slide layout with each slide divided into left accent panel (red or yellow) and right information area. Table structure features 6 columns × 5 rows for item names and monthly or quarterly figures. Business silhouette imagery positioned at bottom-right for visual balance and professional appearance.
Related Products
-

Sales and Profit Calculation Table – Efficient Profit Management
#Financial Plans and Performance #Diagram #Income Statement
-

Table of Contents for Business Success – Financial Planning and Performance
#Financial Plans and Performance #Diagram #Income Statement
-

Sales and Revenue of Data Analysis Services – Optimized Financial Analysis
#Financial Plans and Performance #Diagram #Income Statement
-

Global Revenue Analysis Table – Table for Financial Performance Enhancement
#Financial Plans and Performance #Diagram #Other
