Visualizing Bar Graphs with PC Mockups – Competitive Market Analysis Tool
RJ0400053_17
- Last Update 06/01/2025
- File Size 1.8MB
- # of Slides 2
- File Format PPTX
- Slide Ratio 16:9
- Color
Keywords
- #Content-Based Slides
- #Design-Based Slides
- #Market and Competitor Analysis
- #Graph
- #Other
- #Competitor Analysis
- #Market Analysis
- #Column
- #Segmented Column
- #Mockup
- #16:9
- #laptop mockup PowerPoint
- #vertical bar chart slide
- #mockup presentation template
- #market analysis chart
- #competitive analysis graph
- #data visualization PowerPoint
About the Product
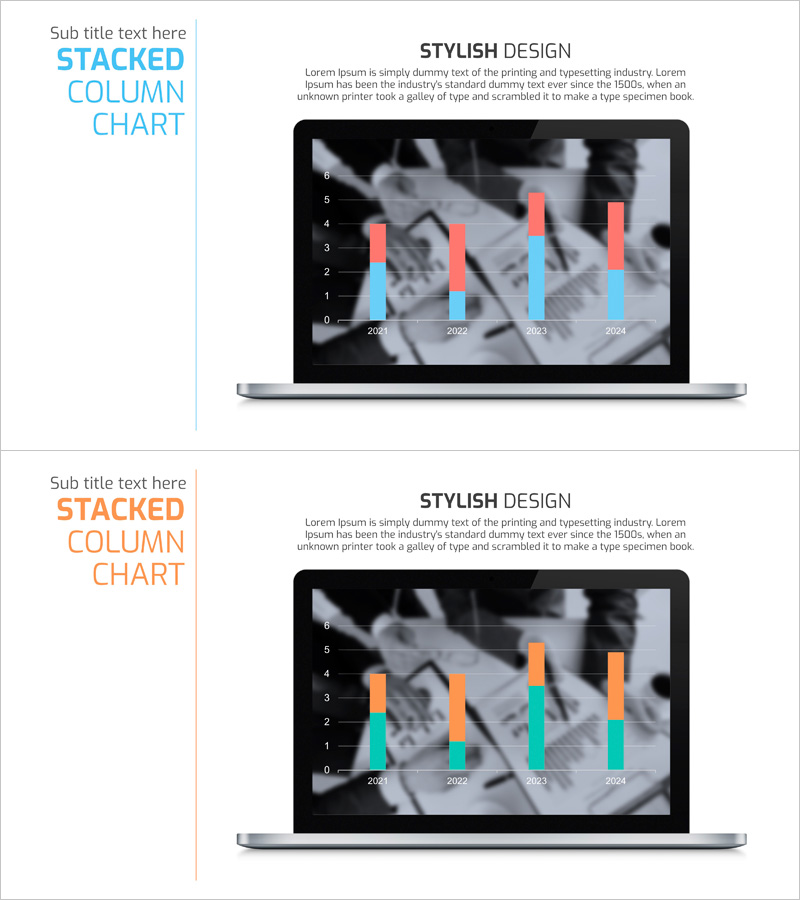
A PowerPoint slide set featuring vertical bar charts displayed on a laptop screen mockup. The design uses blue and red dual-tone colors to compare two data series across four years (2021–2024), making it ideal for business presentations on market analysis, competitive benchmarking, and sales trends. The 2-slide set provides consistent visual styling with color variations, enabling cohesive data visualization throughout your presentation.
Usage Points
-
Main Usage
Visualize market data, competitive analysis, and sales trends using a laptop screen mockup as the display context. The dual-tone color scheme (blue and red) clearly differentiates two data series across four years, emphasizing comparative insights.
-
How to Use
Insert into business reports, marketing plans, and investor pitch decks in sections covering market overview, competitive positioning, and performance metrics. The laptop mockup adds authenticity and context when presenting digital products or services.
-
Recommended For
Marketing managers, business analysts, sales executives, and C-level leaders presenting data-driven insights. Ideal for competitive analysis, sales performance reviews, and customer satisfaction metrics.
-
Slide Structure
2-slide set. Each slide displays a laptop mockup with a vertical bar chart showing 4 years (2021–2024) × 2 data series (blue and red bars). Y-axis ranges from 0 to 6 with gridlines; X-axis shows year labels. Background features a blurred conference room image to reinforce business context.
Related Products
-

Vertical Bar Graph for Sector Analysis – Optimizing Data Visualization
#Market and Competitor Analysis #Graph #Competitor Analysis
-

Console Game Analysis Bar Graph – Market and Competitive Analysis
#Market and Competitor Analysis #Graph #Competitor Analysis
-

PC Mockup & Column Bundle Graph
#Market and Competitor Analysis #Graph #Other
-

Fintech Market Analysis Bar Graph – Clear Data Visualization
#Market and Competitor Analysis #Diagram #Graph
