Subdivided Bar Graph for Visual Market Analysis – Presenting Competitive Data Effectively
RJ0400040_14
- Last Update 05/28/2025
- File Size 2.4MB
- # of Slides 2
- File Format PPTX
- Slide Ratio 16:9
- Color
Keywords
- #Content-Based Slides
- #Design-Based Slides
- #Market and Competitor Analysis
- #Diagram
- #Graph
- #Competitor Analysis
- #Market Analysis
- #Table
- #Column
- #Standard Table
- #Segmented Column
- #16:9
- #subdivided bar chart PowerPoint
- #data comparison slide template
- #market analysis chart
- #competitive analysis graph
- #stacked bar chart PowerPoint slide
About the Product
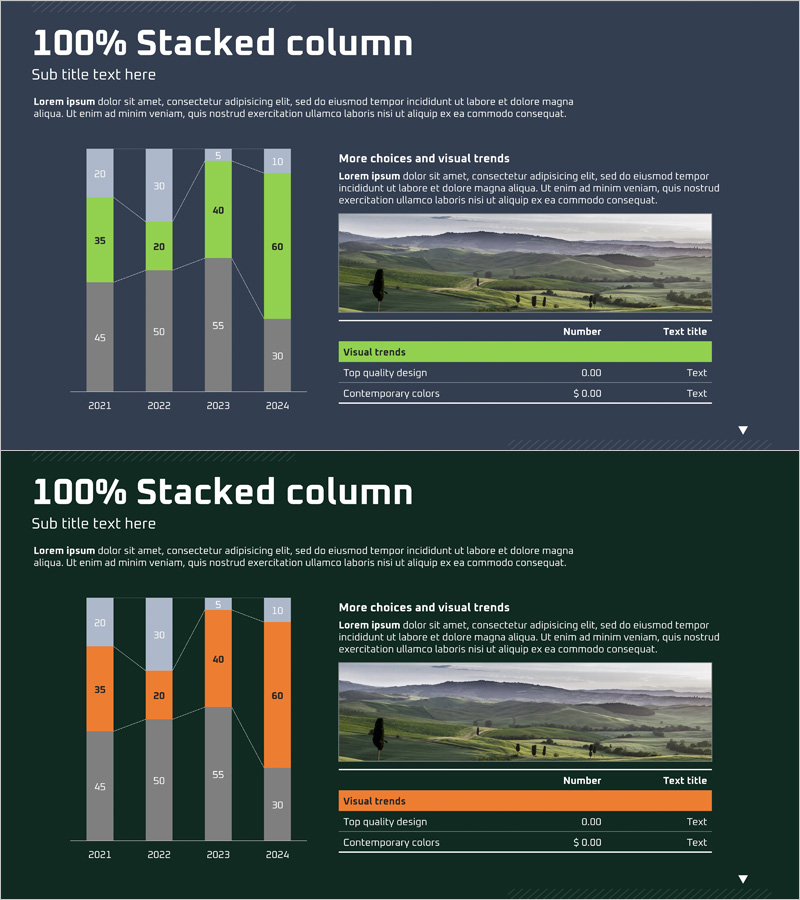
A subdivided bar chart PowerPoint slide optimized for market analysis and competitive comparison. This presentation template visualizes data across four years (2021–2024) segmented into four series, enabling simultaneous year-over-year and cross-series comparison. The design uses lime green and gray tones to highlight key data points, with numeric labels and connector lines ensuring precise information delivery. The slide deck is ready for immediate use in business reports, pitch decks, and analytical presentations.
Usage Points
-
Main Usage
Enables side-by-side comparison of multi-dimensional data across time periods and categories, clearly communicating market positioning and competitive dynamics. The segmented structure simultaneously displays series-level changes and relative magnitude relationships, enhancing credibility in complex data analysis.
-
How to Use
Deploy in the market analysis section of business reports, competitive landscape slides in investor pitch decks, and market overview pages in marketing strategy documents. Simply replace the chart values and legend with your own data to create a ready-to-present slide.
-
Recommended For
Marketing managers, business strategists, financial analysts, management consultants, and sales executives presenting market conditions and competitive analysis. Particularly valuable for data-driven strategy meetings and executive briefings requiring quantitative evidence.
-
Slide Structure
Two-slide set featuring subdivided bar charts with 4 data series across 4 years (2021–2024). First slide emphasizes lime green series; second highlights orange series. Both include numeric labels, stacked bar segments, and trend connectors to reinforce data narrative and comparative insights.
Related Products
-

Market Analysis Segmented Bar Graph & Table Chart – Visualization of Competitive Analysis
#Market and Competitor Analysis #Diagram #Graph
-

Orange Purple Subdivided Graph Table – Visualizing Market Data
#Market and Competitor Analysis #Diagram #Graph
-

Console Game Analysis Bar Graph – Market and Competitive Analysis
#Market and Competitor Analysis #Graph #Competitor Analysis
-

Baby Products Business Competitor Table – Market and Competitor Analysis
#Market and Competitor Analysis #Diagram #Competitor Analysis
