Collaborative Business Cycle Diagram – Prioritizing Marketing Strategy and Execution
RJ0300070_15
- Last Update 05/08/2025
- File Size 0.1MB
- # of Slides 2
- File Format PPTX
- Slide Ratio 16:9
- Color
Keywords
- #Content-Based Slides
- #Design-Based Slides
- #Technical Approach
- #Marketing Plan and Strategy
- #Diagram
- #Service Implementation Plan
- #Marketing Strategy
- #Flow
- #Circular Flow
- #16:9
- #cycle diagram PowerPoint
- #collaborative cycle slide template
- #4-stage process diagram
- #marketing strategy cycle
- #business collaboration PPT slide
About the Product
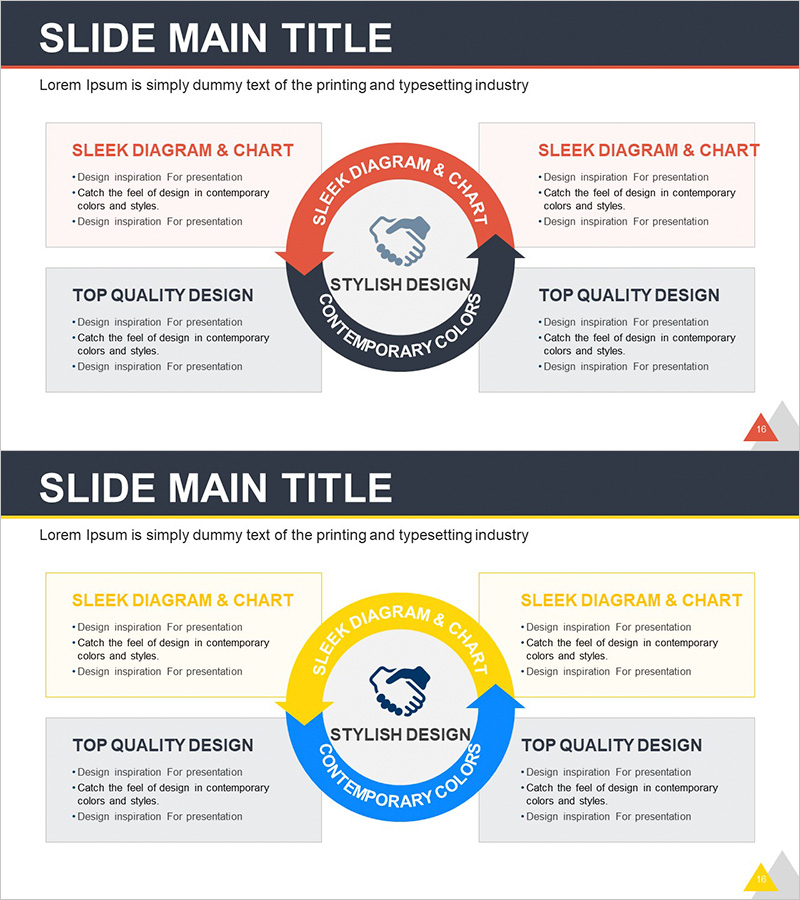
A PowerPoint slide that visualizes marketing strategy and execution process through a 4-stage circular flow diagram. Centered on a handshake icon, red and blue arrows flow clockwise around each stage, with text boxes and description areas positioned for detailed information. This PPT diagram is optimized for illustrating business collaboration, team cooperation, and service execution cycles, ready to use in presentations, planning documents, and strategy reports. The 2-slide set offers multiple color variations in 16:9 widescreen PPTX format.
Usage Points
-
Main Usage
Clearly express marketing strategy phases, execution steps, and team collaboration processes through a 4-stage circular structure. The central handshake icon emphasizes collaboration as the core element, while each stage's text area allows input of specific activities, responsible parties, and timelines. Ideal for explaining business cycles, service execution flows, and cross-organizational cooperation structures.
-
How to Use
Enter marketing strategy items, execution details, and collaboration content into each stage's text box. Adjust colors and arrow thickness as needed. Add detailed information, responsible departments, and timelines to the left and right description areas. During presentation, follow the circular arrows to guide audience understanding through the process flow.
-
Recommended For
Recommended for marketing teams, strategic planning departments, executive reports, cross-departmental collaboration explanations, service operation process sharing, team building sessions, consulting proposals, and business plan presentations. Particularly effective when emphasizing collaboration, cyclical processes, and sustainability.
-
Slide Structure
2-slide set. Each slide features a central 4-stage circular diagram with red and blue accent arrows, a handshake icon at center, left and right text boxes for descriptions, and a title area at top. Optimized in 16:9 widescreen format for projector displays and online presentations.
Related Products
-

Technology Differentiation Strategy Diagram – Effective Execution Plan
#Product/Service Introduction #Technical Approach #Diagram
-

Crop Management System Diagram – Efficient Operational Plan
#Operational Plan #Technical Approach #Diagram
-

Food Ingredient Illustration Circular Diagram – Business Strategy
#Business Strategy #Technical Approach #Diagram
-

Audience Type Analysis Slide for Market and Competitive Analysis
#Market and Competitor Analysis #Marketing Plan and Strategy #Diagram
