5P Marketing Analysis Graph – Effective Strategy Design
RM0100011_26
- Last Update 01/28/2025
- File Size 1.2MB
- # of Slides 2
- File Format PPTX
- Slide Ratio 16:9
- Color
Keywords
- #Content-Based Slides
- #Design-Based Slides
- #Business Vision and Strategy
- #Marketing Plan and Strategy
- #Diagram
- #Graph
- #Business Strategy
- #Marketing Strategy
- #Flow
- #Horizontal Bar
- #Circular Flow
- #Horizontal Bar Chart
- #16:9
- #5P marketing diagram PowerPoint
- #marketing mix circular diagram
- #5P analysis slide template
- #marketing strategy presentation
- #how to create 5P diagram in PowerPoint
About the Product
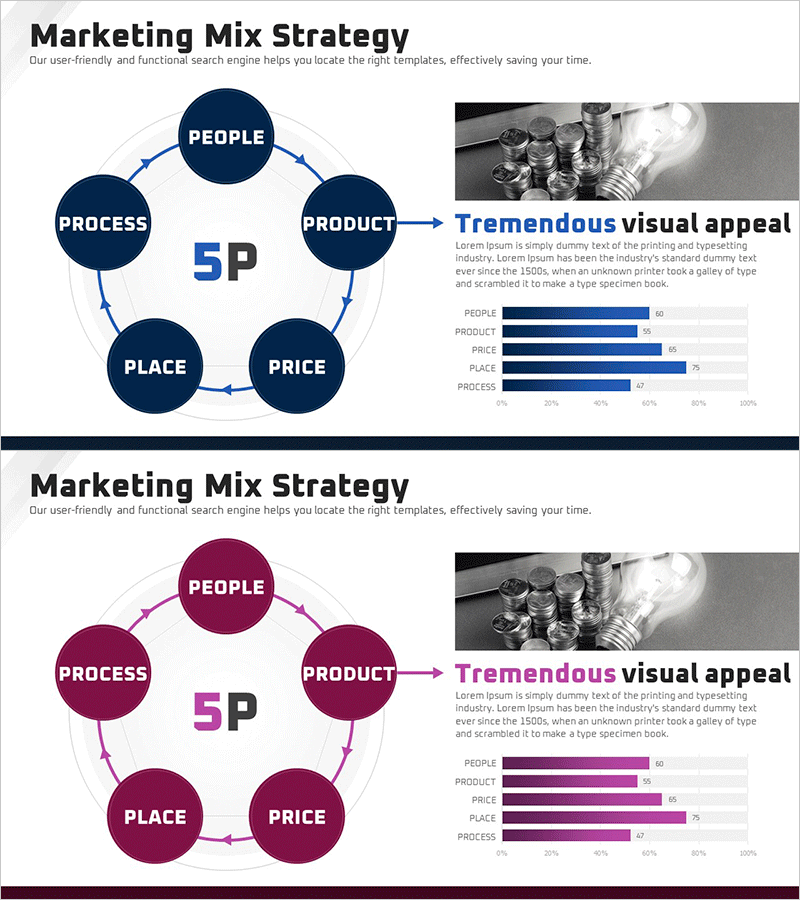
A comprehensive PowerPoint slide visualizing the 5P marketing mix framework (People, Product, Price, Place, Process) through a circular diagram structure. Five key elements radiate from the central 5P node in a continuous cycle, illustrating the interconnected nature of marketing strategy components. The slide includes two color variations—navy blue and burgundy red—each conveying different tones for your presentation context. A horizontal bar chart on the right quantifies the relative importance of each 5P element with percentage values. Ideal for marketing strategy presentations, business reports, and strategic planning documents.
Usage Points
-
Main Usage
Effectively communicate the interconnected nature of the 5P marketing framework during strategy development and analysis phases. The circular structure emphasizes that each element (People, Product, Price, Place, Process) operates as an integrated system rather than isolated components. The accompanying bar chart provides quantitative support by displaying relative importance weights for each factor.
-
How to Use
Deploy this slide in marketing strategy presentations, business plan documents, executive briefings, and strategic planning sessions. The navy blue version establishes a professional, trustworthy tone suitable for formal corporate settings, while the burgundy version conveys creativity and dynamic energy for innovation-focused presentations. Fully editable text fields allow customization of element names and metrics to match your specific industry or business context.
-
Recommended For
Marketing managers, strategy consultants, business analysts, MBA students, corporate executives, and marketing educators preparing presentations on market positioning, product launches, or strategic repositioning initiatives. Particularly valuable for cross-functional teams evaluating marketing effectiveness and resource allocation.
-
Slide Structure
Two-slide set in 16:9 widescreen format (PPTX). Slide 1: Central 5P node with five circular elements (People, Product, Price, Place, Process) connected in continuous cycle + horizontal bar chart (5 data series, 0–100% scale) on right side. Slide 2: Identical layout in burgundy red color scheme. All text and chart values are fully editable.
Related Products
-

5P Marketing Mix Circular Diagram - Visualizing Business Strategies
#Business Vision and Strategy #Marketing Plan and Strategy #Diagram
-

4P Strategy Cycle Diagram – Key to Marketing Success
#Business Vision and Strategy #Marketing Plan and Strategy #Diagram
-

Business Strategy Cycle Diagram – Effective Business Strategy Representation
#Business Vision and Strategy #Marketing Plan and Strategy #Diagram
-

Product Strategy Cycle Diagram – Business Strategy and Marketing Roadmap
#Business Vision and Strategy #Marketing Plan and Strategy #Diagram
