5P Marketing Mix Circular Diagram - Visualizing Business Strategies
RM0100012_26
- Last Update 01/28/2025
- File Size 1.5MB
- # of Slides 2
- File Format PPTX
- Slide Ratio 16:9
- Color
Keywords
- #Content-Based Slides
- #Design-Based Slides
- #Business Vision and Strategy
- #Marketing Plan and Strategy
- #Diagram
- #Graph
- #Business Strategy
- #Marketing Strategy
- #Flow
- #Horizontal Bar
- #Circular Flow
- #Horizontal Bar Chart
- #16:9
- #5P marketing mix diagram
- #circular diagram PowerPoint
- #marketing strategy slide
- #marketing mix template
- #business strategy visualization
About the Product
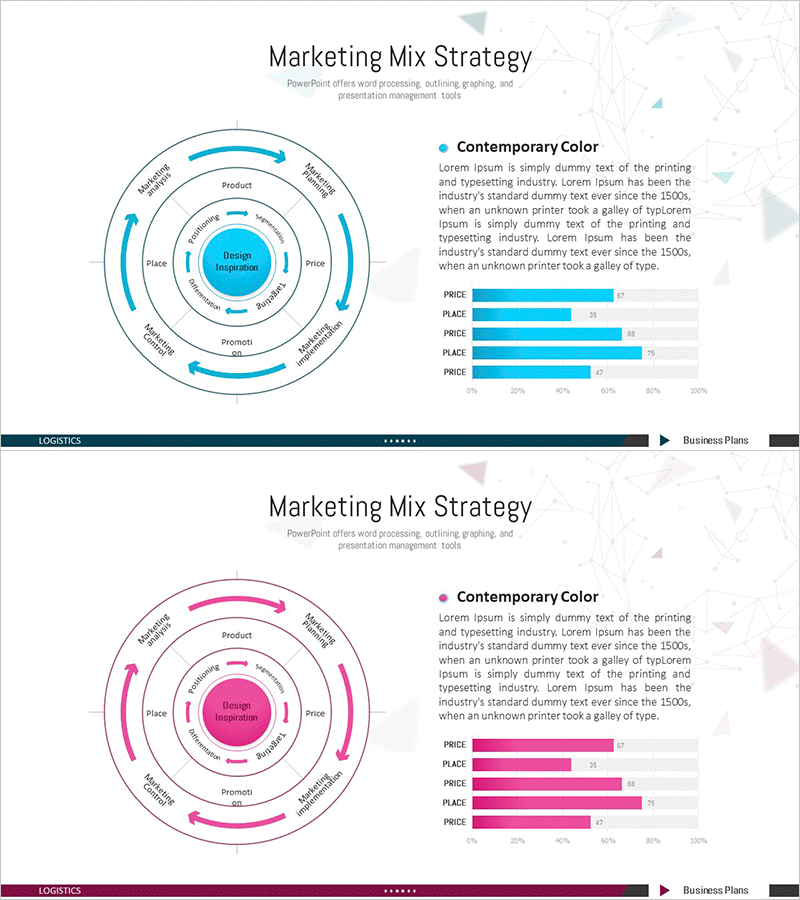
A comprehensive 5P marketing mix circular diagram PowerPoint slide for visualizing marketing strategy. The design features a concentric circle structure with the central 'Design Inspiration' element surrounded by five key components: Product, Price, Place, Promotion, and People. Directional arrows connect each element to show cyclical relationships and interdependencies. Two color versions—blue and pink—are provided to match your corporate brand identity. A horizontal bar chart on the right displays comparative metrics for each element, enabling quantitative analysis alongside the conceptual framework. This PowerPoint slide deck is ready to use in business strategy presentations, marketing planning sessions, executive briefings, and client proposals.
Usage Points
-
Main Usage
Visualizes the five core elements of marketing strategy (Product, Price, Place, Promotion, People) in a concentric circle structure, enabling stakeholders to understand the relationships and balance among all components at a glance. Helps marketing teams, executives, and sales leaders align on strategic priorities and execution plans.
-
How to Use
Deploy this slide during strategy development workshops, marketing plan presentations, or quarterly business reviews. Input actual investment ratios, priority levels, or performance metrics into the bar chart to provide quantitative evidence. Select either the blue or pink version to match your corporate branding and maintain visual consistency throughout your presentation deck.
-
Recommended For
Marketing managers, strategy planners, C-suite executives, and sales leaders presenting at strategic planning meetings, quarterly business reviews, project kickoffs, and client pitches. Ideal for B2B companies preparing business strategy reports, marketing plans, and corporate overview presentations.
-
Slide Structure
Concentric circle layout with central 'Design Inspiration' hub surrounded by five labeled segments (Product, Price, Place, Promotion, People) connected by directional arrows showing cyclical flow. Right side features a horizontal bar chart with four data series for comparative metrics. Two-slide set includes blue and pink color variations for brand flexibility.
Related Products
-

5P Marketing Analysis Graph – Effective Strategy Design
#Business Vision and Strategy #Marketing Plan and Strategy #Diagram
-

Business Direction Strategy Structure Diagram – Visual Planning for Business Efficiency
#Business Vision and Strategy #Marketing Plan and Strategy #Diagram
-

Product Strategy Cycle Diagram – Business Strategy and Marketing Roadmap
#Business Vision and Strategy #Marketing Plan and Strategy #Diagram
-

Space Business Strategy Connection Diagram – Vision of Innovation
#Business Vision and Strategy #Marketing Plan and Strategy #Diagram
