Customer and Market Analysis Slide – Yellow and Bluegreen Emotion
RJ0400004_6
- Last Update 05/18/2025
- File Size 1.5MB
- # of Slides 2
- File Format PPTX
- Slide Ratio 16:9
- Color
Keywords
- #Content-Based Slides
- #Design-Based Slides
- #Market and Competitor Analysis
- #Graph
- #Other
- #Customer Analysis
- #Market Analysis
- #Horizontal Bar
- #Horizontal Bar Chart
- #16:9
- #horizontal bar chart PowerPoint
- #bar graph slide template
- #data comparison chart
- #market analysis slide
- #customer analysis PowerPoint template
About the Product
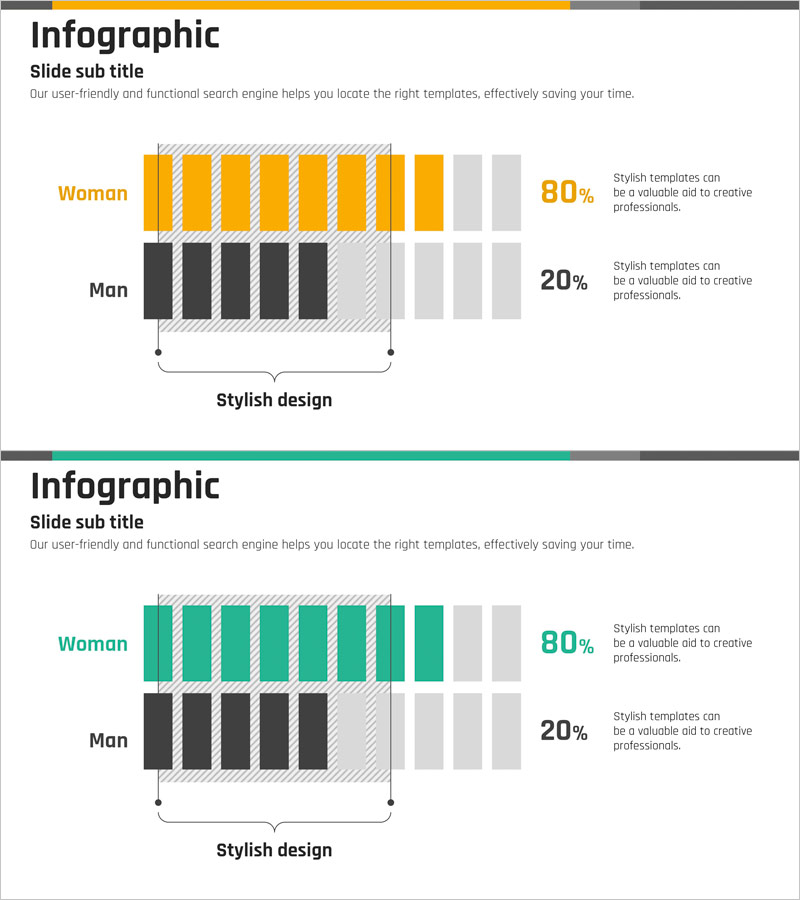
A horizontal bar chart PowerPoint slide designed for customer and market analysis presentations. This slide template visualizes two-series data using yellow and teal color schemes, with percentage values and descriptive text areas for each category. The 16:9 widescreen format includes 2 fully editable slides suitable for comparing customer segments, market share, demographic breakdowns, and other comparative data. All chart elements, labels, and text boxes can be customized to match your specific data and branding requirements.
Usage Points
-
Main Usage
Visualize two-series comparative data such as customer segmentation, market share, and demographic analysis using horizontal bar format. The contrasting yellow and teal colors clearly distinguish each data series, while percentage values and descriptive text enhance information clarity and presentation impact.
-
How to Use
Open the slide and replace existing data with your own figures. Bar lengths, colors, percentage text, category names, and descriptions are all fully editable. Simply update the values and labels to match your analysis. Use in business reports, marketing presentations, investor pitches, and strategic planning meetings.
-
Recommended For
Marketing managers, sales directors, executives, consultants, and data analysts presenting customer analysis, market research, and comparative performance metrics. Ideal for scenarios comparing two distinct groups such as male/female, new/existing customers, or competitor benchmarking.
-
Slide Structure
2-slide set with each slide divided into a horizontal bar chart area and right-side text description zone. First slide displays yellow-series data (Woman 80%), second slide shows teal-series data (Man 20%), with striped background bars indicating the full range scale for each category.
Related Products
-

Gender Ratio Customer Analysis 3D Circle Graph – Insights for Market Understanding
#Market and Competitor Analysis #Graph #Other
-

Mobile Application Analysis Graph – Data Visualization for Market Understanding
#Market and Competitor Analysis #Graph #Other
-

Comparative Chart of Male and Female Professionals
#Market and Competitor Analysis #Graph #Other
-

Orange Green Customer Analysis and Bell Chart
#Market and Competitor Analysis #Graph #Other
