Quality PowerPoint Wide Template Analysis of Men and Women
RJ0200020_11
- Last Update 04/02/2025
- File Size 6.3MB
- # of Slides 2
- File Format PPTX
- Slide Ratio 16:9
- Color
Keywords
- #Content-Based Slides
- #Design-Based Slides
- #Market and Competitor Analysis
- #Graph
- #Customer Analysis
- #Market Analysis
- #Circles
- #Doughnut Chart
- #16:9
- #donut chart PowerPoint slide
- #pie chart gender analysis
- #demographic ratio presentation
- #donut graph template download
- #gender distribution PowerPoint
- #how to create donut chart in PowerPoint
About the Product
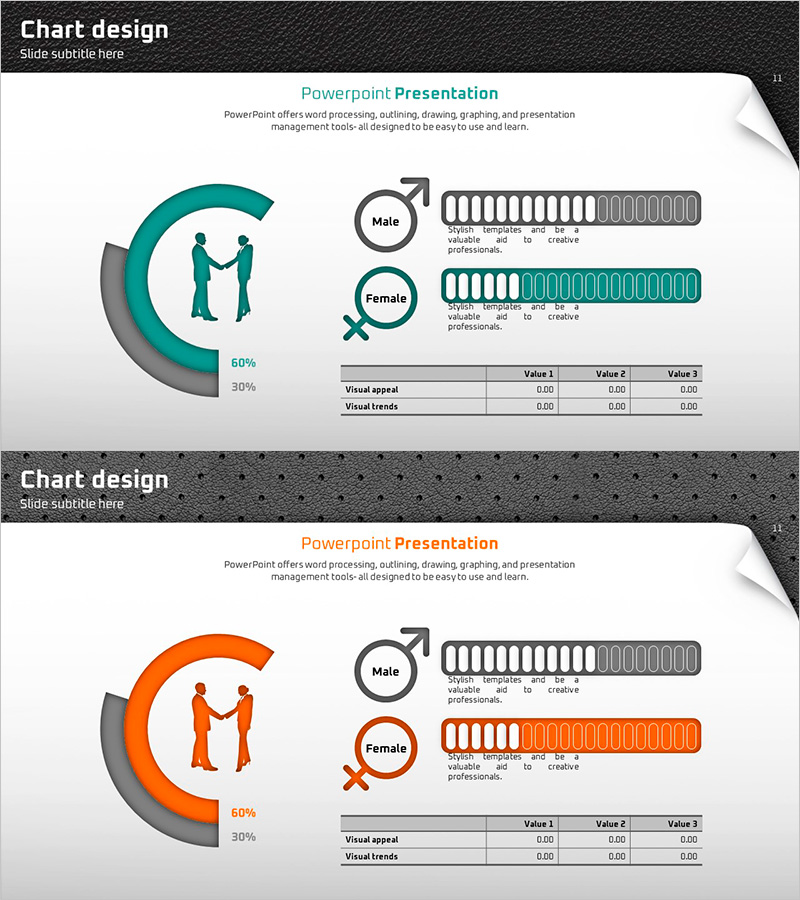
A professional donut chart PowerPoint slide set designed to visualize gender distribution and demographic ratios. This 2-slide template features teal and orange color schemes, each slide incorporating gender icons, percentage values (60% and 30%), horizontal bar graphs, and data tables for comprehensive data representation. Ideal for market research presentations, customer segmentation analysis, and demographic reports that require clear visual communication of gender-based statistics and audience composition.
Usage Points
-
Main Usage
Visualize gender distribution, demographic data, and customer segmentation using donut-shaped pie charts. Emphasize key percentages (60%, 30%) while supplementing with horizontal bar graphs and data tables for multi-layered information presentation and audience composition analysis.
-
How to Use
Insert into market research reports' target audience analysis sections, marketing plans' customer profile pages, or business proposals' market overview slides. Edit donut chart percentages with your own data, adjust icons and colors to match your brand identity, and customize table values as needed.
-
Recommended For
Marketing professionals, market research analysts, sales planning teams, business development managers, educators, consultants, and executives presenting customer analysis, gender statistics, and demographic insights. Particularly effective for B2B and B2C companies developing customer segmentation strategies and audience profiling.
-
Slide Structure
Each slide features a donut pie chart on the left (showing 60% and 30% proportions), gender icons (male and female symbols) in the center, two horizontal bar graphs on the right (male and female data series), and a data table at the bottom (Visual appeal and Visual trends rows). Both slides maintain identical layouts with color variations in teal and orange.
Related Products
-

User Analysis Graph by Year – Insights into Customer Behavior
#Market and Competitor Analysis #Graph #Other
-

Market Demand Analysis PowerPoint Slide – Donut Chart Layout
#Market and Competitor Analysis #Graph #Customer Analysis
-

Global Business PowerPoint Template Wide Donut Chart
#Market and Competitor Analysis #Graph #Customer Analysis
-

Happy Kids and Donuts Chart – Enjoyable Market Analysis
#Market and Competitor Analysis #Graph #Customer Analysis
