Shopping Mall User Gender Ratio Analysis Chart
RJ0400046_33
- Last Update 05/29/2025
- File Size 0.5MB
- # of Slides 2
- File Format PPTX
- Slide Ratio 16:9
- Color
Keywords
- #Content-Based Slides
- #Design-Based Slides
- #Market and Competitor Analysis
- #Graph
- #Other
- #Customer Analysis
- #Market Analysis
- #Circles
- #Doughnut Chart
- #16:9
- #doughnut chart PowerPoint
- #pie chart slide template
- #gender ratio analysis
- #ratio visualization PPT
- #donut graph presentation
- #user demographic chart
About the Product
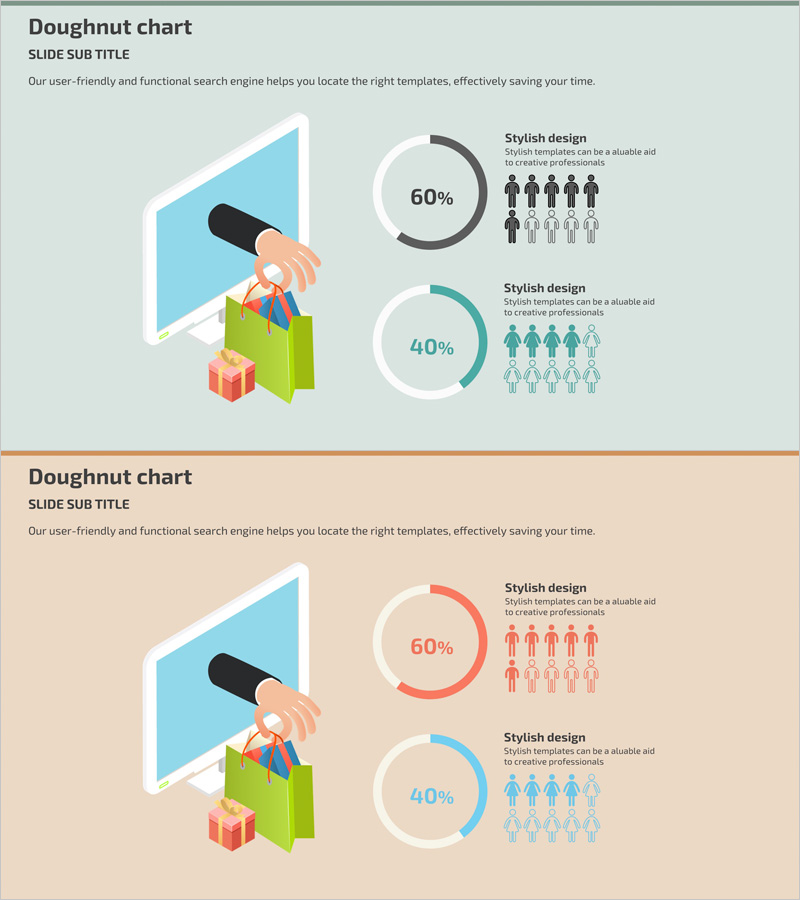
A doughnut chart PowerPoint slide designed to visualize shopping mall user gender composition with clarity and impact. The template features two doughnut charts displaying 60% and 40% ratios in gray, teal, and coral tones against light gray and beige backgrounds. A left-side illustration (shopping bag and pointing hand) combined with right-side user icons reinforces the data context. Ample text areas allow for additional analysis commentary. The 16:9 widescreen format includes 2 slides ready for immediate editing and presentation use.
Usage Points
-
Main Usage
Designed to present shopping mall and e-commerce platform user gender composition at a glance. The doughnut chart format intuitively conveys part-to-whole ratios, while the dual-chart layout enables side-by-side comparison of gender distribution across time periods or product categories.
-
How to Use
Use in marketing reports, business analysis presentations, and investor pitch decks to showcase customer demographic data. Edit chart values and labels with your actual data, then add analysis conclusions or key insights in the text areas. Background and chart colors can be customized to match corporate branding guidelines.
-
Recommended For
Ideal for e-commerce and shopping platform marketing teams, data analysts, business intelligence professionals, and executives preparing demographic reports. Particularly valuable when segmenting customers and developing targeted marketing strategies based on gender composition.
-
Slide Structure
2-slide set. Each slide features a light gray (top) and beige (bottom) background with left-side illustration area and two doughnut charts (60% and 40% ratios) on the right. Text labels and explanation areas above charts allow for data interpretation and additional commentary.
Related Products
-

User Analysis Graph by Year – Insights into Customer Behavior
#Market and Competitor Analysis #Graph #Other
-

Work Performance Analysis Graph – Visually Representing Employee Performance
#Market and Competitor Analysis #Graph #Other
-

User Analysis Donut Chart – Optimal for Market and Competitor Analysis
#Market and Competitor Analysis #Graph #Other
-

Purple Brown Market Share Analysis – Emphasizing Visual Appeal
#Market and Competitor Analysis #Graph #Other
