Horizontal Bar Graph for Academic Achievement – Market and Competitive Analysis
RJ0500025_21
- Last Update 06/13/2025
- File Size 0.5MB
- # of Slides 2
- File Format PPTX
- Slide Ratio 16:9
- Color
Keywords
About the Product
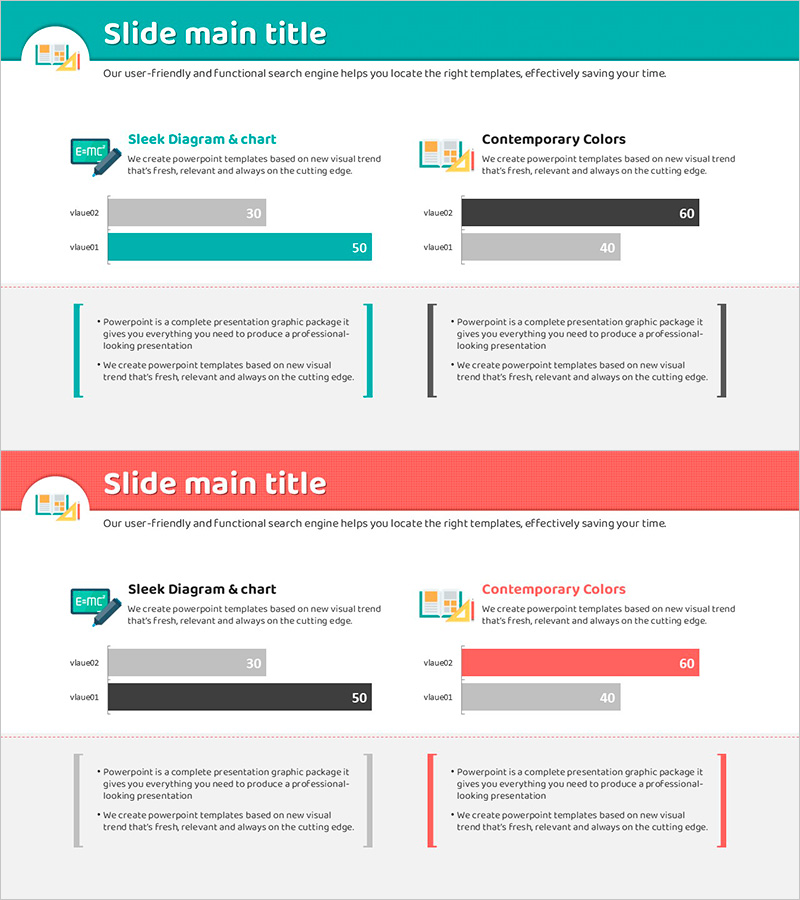
A 2-slide horizontal bar graph PowerPoint presentation featuring a teal and black dual-tone color scheme for clear data comparison. Each slide displays three items arranged horizontally, enabling intuitive visual comparison of values across categories. Perfect for market analysis, competitive benchmarking, performance evaluation, and business presentations. Fully editable in PPTX format with 16:9 widescreen ratio, allowing you to customize all text, labels, and numerical values to match your specific data.
Usage Points
-
Main Usage
Visualizes quantitative data by arranging bars horizontally to compare multiple items side by side. Effectively communicates market size, sales volume, market share, performance metrics, and other numerical information with clarity and impact.
-
How to Use
Adjust bar lengths to input your actual data values and modify axis labels and legend text as needed. The teal and black color scheme creates visual emphasis and contrast, directing audience attention to key data points.
-
Recommended For
Ideal for marketing professionals, sales managers, and executives preparing business reports. Suitable for market analysis, competitive benchmarking, quarterly performance reviews, product sales comparisons, and strategic planning presentations.
-
Slide Structure
2-slide layout with 3 horizontal bars per slide. First slide emphasizes teal accent color; second slide uses black accent to distinguish different data series. 16:9 widescreen ratio in fully editable PPTX format.
Related Products
-

Performance Analysis 3D Bar Chart & Table – Market and Performance Analysis
#Company Introduction #Market and Competitor Analysis #Diagram
-

Interest Type Analysis for Children – Market and Competitor Analysis
#Market and Competitor Analysis #Graph #Competitor Analysis
-

Pencil Bar Chart for Market Analysis – Visual Competitiveness
#Market and Competitor Analysis #Graph #Other
-

Scientific Research Results Graph – A Tool for Market Analysis and Competitive Advantage
#Market and Competitor Analysis #Graph #Market Analysis
