Visualizing Business Development Status with Donut Chart Slide
RJ0300052_6
- Last Update 05/02/2025
- File Size 4.4MB
- # of Slides 2
- File Format PPTX
- Slide Ratio 16:9
- Color
Keywords
- #Content-Based Slides
- #Design-Based Slides
- #Product/Service Introduction
- #Business Introduction
- #Graph
- #Development Status
- #Technological Status
- #Circles
- #Doughnut Chart
- #16:9
- #donut chart PowerPoint slide
- #pie chart template
- #data comparison slide
- #business status visualization
- #how to create donut chart in PowerPoint
About the Product
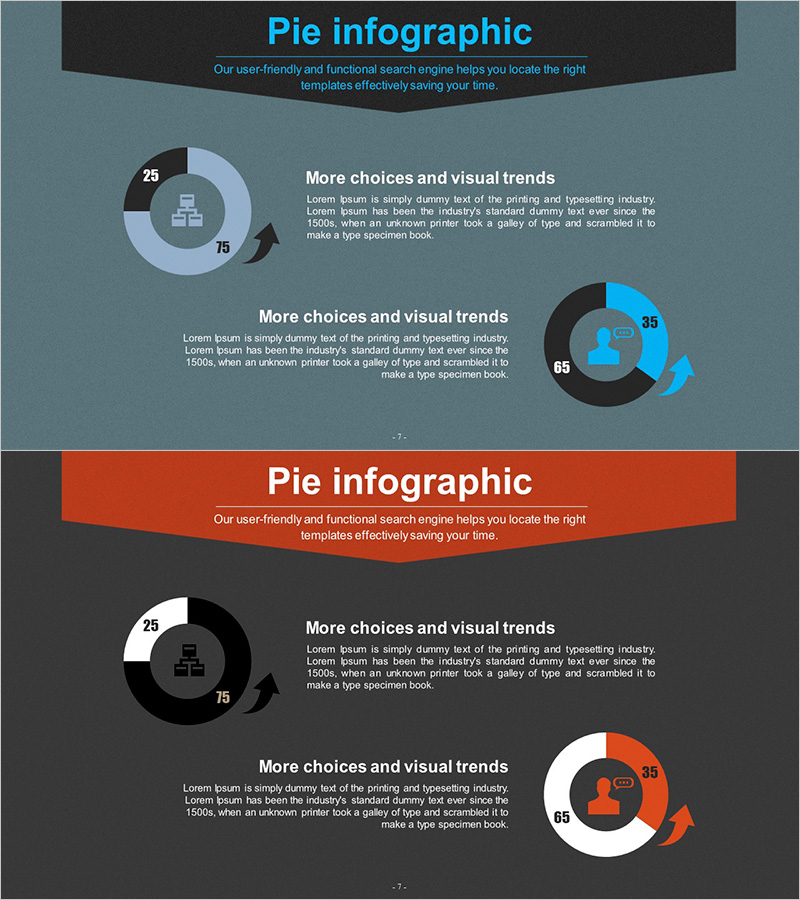
A 2-slide PowerPoint template featuring donut charts to visualize business development status and project progress. The dual-color donut design in blue and orange tones displays two data series simultaneously, with percentage values and central icons for clear data representation. Optimized for 16:9 widescreen format in PPTX, this presentation slide set is ready to use for business introductions, technology status updates, and project completion reports. The balanced layout between text and chart areas enables effective communication of both narrative and quantitative information.
Usage Points
-
Main Usage
Displays two data series side-by-side using donut chart visualization, enabling direct ratio comparison. Central icon areas clarify chart topics while numerical labels ensure accurate data communication. Ideal for representing business development progress, project completion rates, market share distribution, and other composition-based metrics.
-
How to Use
Double-click the donut chart to edit data values; percentages update automatically. Modify chart titles, descriptions, and legends in the text boxes. Adjust colors through PowerPoint shape formatting options. Insert into business introduction, technology status, or performance analysis sections of presentations.
-
Recommended For
Business development teams, marketing professionals, and executives preparing status reports. Recommended for roles requiring quantitative data visualization in investor pitches, business plans, quarterly performance reports, and product introduction presentations.
-
Slide Structure
2-slide layout with left text area (title and description) and right donut chart area. Each donut comprises 2 data series (blue and orange segments) with a central icon placeholder. Header area for slide titles and footer space for legends and supplementary text.
Related Products
-

Space Industry Development Status Graph – Capturing the Future of Industry
#Product/Service Introduction #Business Introduction #Graph
-

Business Development Status Donut Graph – A Template for Visual Communication
#Product/Service Introduction #Business Introduction #Diagram
-

Mobile App Service Development Status – Doughnut Chart Visualization
#Product/Service Introduction #Business Introduction #Graph
-

Cat Donut Chart – Data Analysis and Creativity
#Product/Service Introduction #Business Introduction #Diagram
