Competitor Analysis and Competitive Advantage Visualization – Harmony of Green and Orange
RJ0400024_6
- Last Update 05/24/2025
- File Size 2.3MB
- # of Slides 2
- File Format PPTX
- Slide Ratio 16:9
- Color
Keywords
- #Content-Based Slides
- #Design-Based Slides
- #Market and Competitor Analysis
- #Diagram
- #Graph
- #Competitor Analysis
- #Competitive Advantage
- #Table
- #Horizontal Bar
- #Standard Table
- #Double Horizontal Bar
- #16:9
- #diverging bar chart PowerPoint
- #left-right comparison chart template
- #competitor analysis slide
- #dual-axis bar graph presentation
- #data comparison PowerPoint template
About the Product
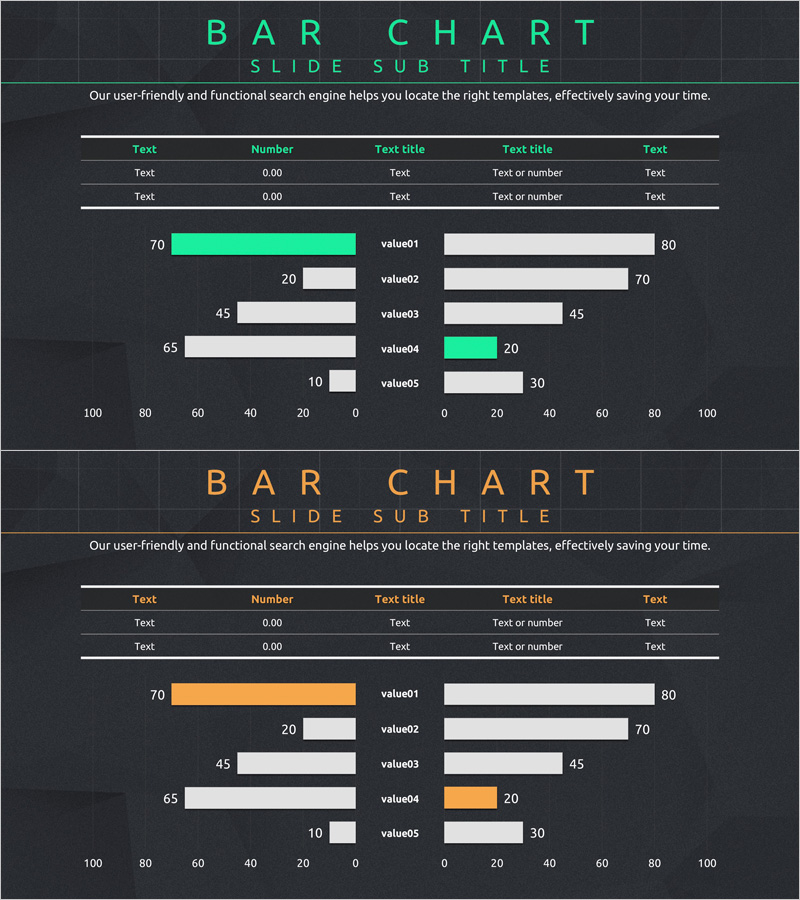
A diverging bar chart PowerPoint slide designed to visualize competitor analysis and competitive advantage through side-by-side data comparison. Five items are symmetrically arranged on the left and right sides, allowing instant visual comparison of metrics. Green and orange accent bars highlight key figures, making critical data points stand out. The embedded data table enables quick editing for marketing strategy, market analysis, organizational comparison, and competitive positioning presentations. The 16:9 widescreen format with 2-slide layout ensures seamless presentation flow.
Usage Points
-
Main Usage
Ideal for presenting competitor analysis, market comparisons, and organizational performance metrics where two datasets must be displayed simultaneously. The left-right symmetrical structure intuitively conveys numerical differences between groups, while green and orange accent colors emphasize critical data points.
-
How to Use
Enter item names and values in the data table to automatically update the bar chart. Input left-side and right-side data separately to complete your comparative analysis. Apply color accents to the most important metrics to direct audience attention and enhance message retention.
-
Recommended For
Marketing professionals, strategic planners, sales executives, management consultants, financial analysts, and business intelligence teams. Particularly effective for executive briefings, investor presentations, market analysis reports, and competitive positioning discussions.
-
Slide Structure
2-slide layout. First slide features a green-accented diverging bar chart with 5 symmetrical items; second slide displays an orange-accented diverging bar chart with 5 symmetrical items. Each slide includes title and subtitle areas at the top, data table and chart in the center, and legend with explanatory text at the bottom.
Related Products
-

Benchmarking with Bar Chart Comparison
#Market and Competitor Analysis #Diagram #Graph
-

Gender Ratio Bar Graph – Market and Competitor Analysis
#Market and Competitor Analysis #Graph #Competitor Analysis
-

Competitor Analysis and Advantage Chart – The Harmony of Blue and Red
#Market and Competitor Analysis #Graph #Competitor Analysis
-

Business Competitor Analysis Graph
#Market and Competitor Analysis #Graph #Competitor Analysis
