Global Logistics Competitor Chart
RB0100095_4
- Last Update 03/07/2025
- File Size 1.9MB
- # of Slides 2
- File Format PPTX
- Slide Ratio 4:3
- Color
Keywords
About the Product
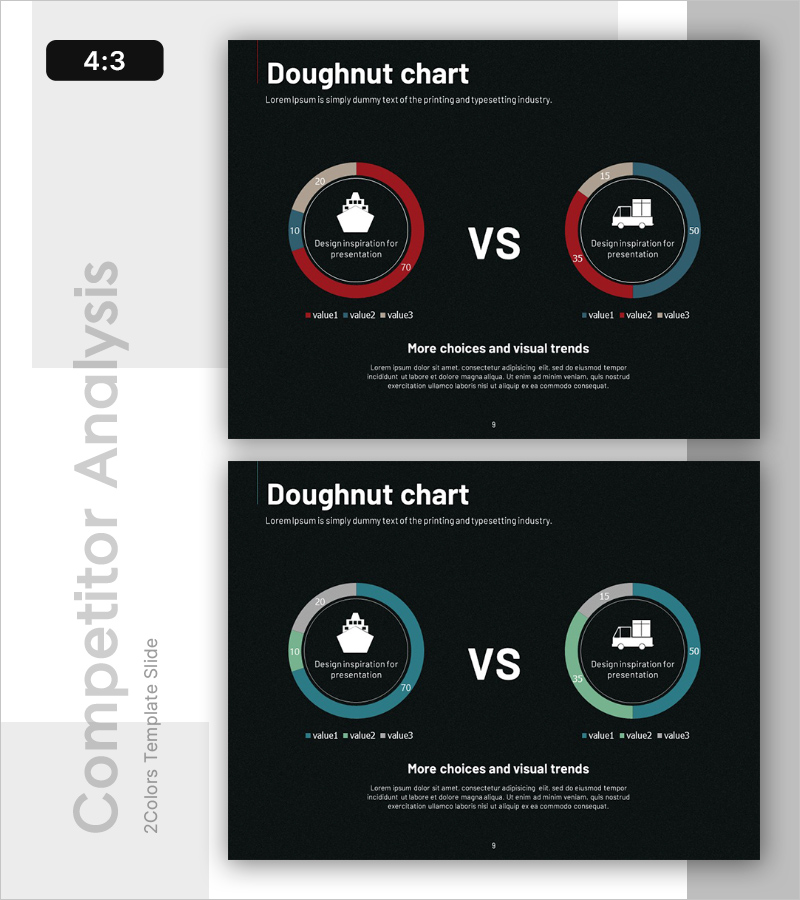
A doughnut chart PowerPoint slide designed for global logistics and transportation competitor analysis. Two doughnut graphs are arranged in a VS layout against a dark background, using red-blue and blue-green color schemes to visually contrast competitive relationships. Each doughnut is divided into three data segments with industry-specific icons (ship and truck) at the center to represent categories. The 2-slide set provides color variations for flexible presentation contexts. Fully editable PPTX format enables quick customization of data values and labels.
Usage Points
-
Main Usage
Visualizes competitive analysis and market share comparison using doughnut graphs. The center icons emphasize industry characteristics (transportation and logistics), while the VS layout highlights the strengths of two competing entities. Ideal for investor presentations, strategic planning meetings, and market analysis reports.
-
How to Use
Double-click each doughnut segment to input data values. Replace legend labels (value1, value2, value3) with your own metrics. Swap center icons with alternative industry symbols and adjust colors using the theme color palette. All elements are fully editable.
-
Recommended For
Executives, strategy teams, marketing departments, and sales teams presenting competitive positioning. Applicable beyond logistics to finance, manufacturing, and distribution industries. Recommended for quarterly performance comparisons and new business proposals.
-
Slide Structure
Slide 1: Two doughnut charts in VS layout with red-blue color scheme, industry icons at center, 3-series legend / Slide 2: Identical structure with blue-green color variation. 4:3 aspect ratio, PPTX format, 2-slide set.
Related Products
-

Dental Caries Treatment Analysis Donut Circle Graph – A Clear Competitive Edge
#Market and Competitor Analysis #Diagram #Graph
-

Business Competitive Advantage Analysis Graph – Differentiation in the Market
#Market and Competitor Analysis #Diagram #Graph
-

Horizontal Bar Chart for Competitive Advantage Analysis – Sea Lighthouse
#Market and Competitor Analysis #Diagram #Graph
-

Market Analysis Slide Using Donut Charts and Table
#Market and Competitor Analysis #Diagram #Graph
