Vertical Bar Chart Slide for Data Comparison
RB0800025_7
- Last Update 03/23/2025
- File Size 0.2MB
- # of Slides 2
- File Format PPTX
- Slide Ratio 4:3
- Color
Keywords
- #Content-Based Slides
- #Design-Based Slides
- #Market and Competitor Analysis
- #Graph
- #Competitor Analysis
- #Competitive Advantage
- #Horizontal Bar
- #Grouped Horizontal Bar
- #4:3
- #vertical bar chart PowerPoint
- #bar graph slide template
- #data comparison presentation
- #how to create bar chart in PowerPoint
- #multi-series chart slide
About the Product
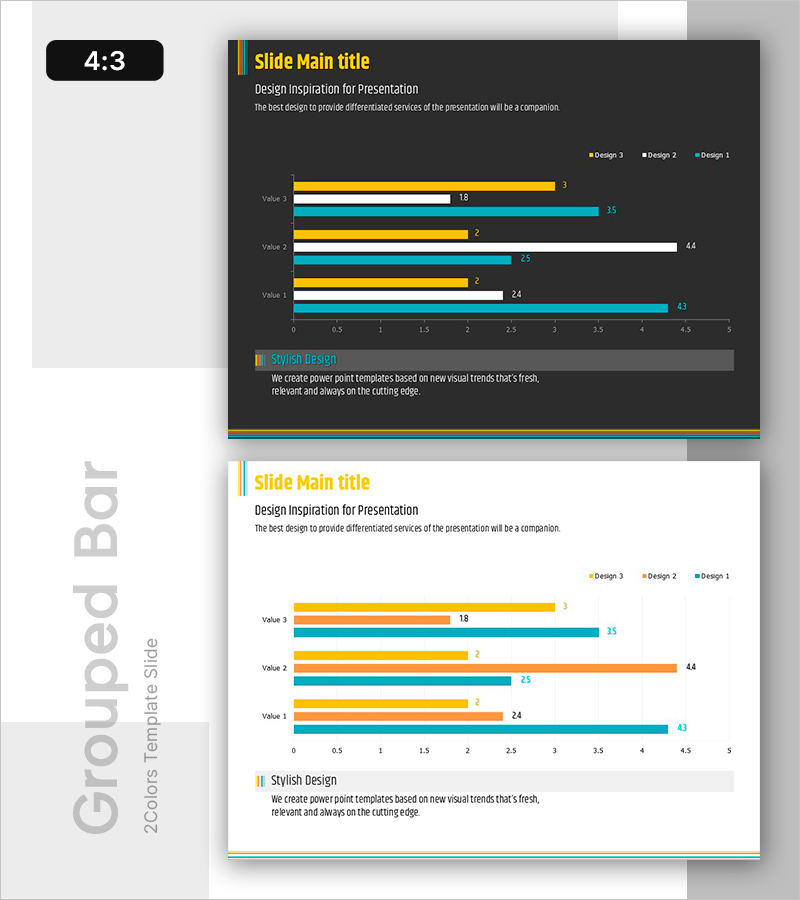
A vertical bar chart PowerPoint slide designed for comparing three data series side by side. The dark background features yellow, blue, and white bar series, optimized for numerical comparison and ranking analysis. Delivered as a 4:3 ratio 2-slide set ready for immediate use in presentations, reports, and business proposals. Each bar displays numerical labels for precise data communication and easy interpretation.
Usage Points
-
Main Usage
Compares multiple items numerically and visualizes rankings across three data dimensions. Ideal for presenting sales figures, performance metrics, and quantitative indicators with clarity and impact.
-
How to Use
Input your actual data values into the slide, and bar lengths adjust automatically. Customize legend labels and axis titles to match your presentation context. The dark background ensures excellent readability in projector environments.
-
Recommended For
Sales and marketing reports, quarterly performance presentations, market research findings, budget execution summaries, and executive briefings. Highly effective for finance, consulting, and manufacturing sectors requiring data-driven decision support.
-
Slide Structure
2-slide set in 4:3 format. Slide 1: Title + vertical bar chart with 3 data series (Value 1-3, each with 3 bars). Slide 2: Alternative layout with same structure. Numerical labels on each bar, legend included, X-axis scale 0-5.
Related Products
-

Slide Emphasizing Social Service Strengths through Competitive Analysis
#Market and Competitor Analysis #Graph #Text Box
-

Blue Green Graph Numerical Change Analysis – Ideal for Market and Competitive Analysis Presentation
#Market and Competitor Analysis #Diagram #Graph
-

Summary Analysis Bar Chart Bundle – Optimal for Market Competitor Analysis
#Market and Competitor Analysis #Graph #Competitor Analysis
-

Carbon Neutral Competitive Advantage Horizontal Chart
#Market and Competitor Analysis #Graph #Competitor Analysis
