Carbon Neutral Competitive Advantage Horizontal Chart
RJ0600018_31
- Last Update 06/25/2025
- File Size 0.6MB
- # of Slides 2
- File Format PPTX
- Slide Ratio 16:9
- Color
Keywords
- #Content-Based Slides
- #Design-Based Slides
- #Market and Competitor Analysis
- #Graph
- #Competitor Analysis
- #Competitive Advantage
- #Horizontal Bar
- #Grouped Horizontal Bar
- #16:9
- #horizontal bar chart PowerPoint
- #grouped chart template
- #multi-series comparison slide
- #data visualization PowerPoint
- #how to create grouped bar chart in PowerPoint
About the Product
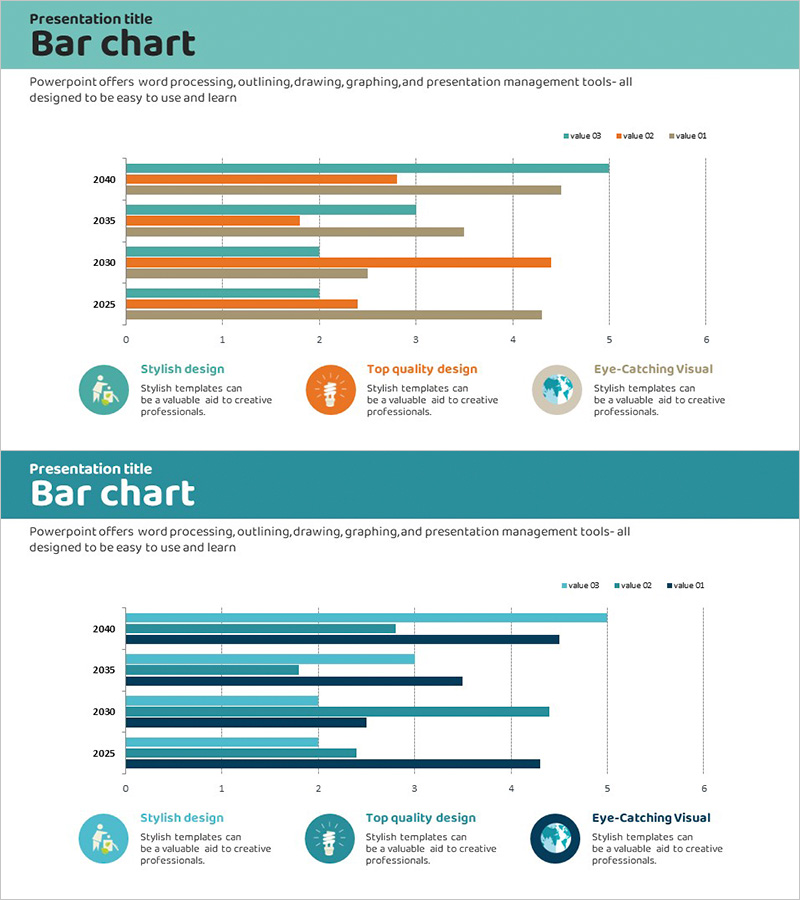
A grouped horizontal bar chart PowerPoint slide comparing 5 years of data across 3 data series. Three color-coded bars (teal, orange, brown) are positioned side-by-side for each year, enabling intuitive numerical comparison and trend analysis. This 2-slide deck in 16:9 widescreen format is ready to use in competitive advantage, carbon neutrality, and sustainability presentations. Clear gridlines and legend enhance data readability, while each slide includes a dedicated section at the bottom with 3 icon-based key points for emphasis. Fully editable in PowerPoint for custom data integration.
Usage Points
-
Main Usage
Simultaneously compare numerical data across 3 series (e.g., years, regions, products) to demonstrate performance trends, competitive positioning, or carbon reduction progress. Ideal for executive reports, investor presentations, sustainability reports, and strategic announcements where multiple metrics must be compared at a glance.
-
How to Use
Replace bar lengths with your actual data values and update the legend series names to match your presentation context. Adjust gridline spacing and axis range to control data emphasis. Customize the bottom icon section with your key messages to reinforce insights and conclusions.
-
Recommended For
Finance, marketing, strategy, and operations professionals presenting quarterly or annual performance comparisons, regional or product sales benchmarks, and competitive analysis. ESG officers can use it to showcase multi-year carbon reduction, energy efficiency, and social impact metrics.
-
Slide Structure
2 slides with identical layout: title area at top, central 5-row × 3-series grouped horizontal bar chart (years 2040, 2035, 2030, 2025), legend on right (value Q3, Q2, Q1), and 3 icon-text boxes at bottom (Stylish Design, Top Quality Design, Eye-Catching Visual). 16:9 aspect ratio, fully editable PPTX format.
Related Products
-

Slide Emphasizing Social Service Strengths through Competitive Analysis
#Market and Competitor Analysis #Graph #Text Box
-

Summary Analysis Bar Chart Bundle – Optimal for Market Competitor Analysis
#Market and Competitor Analysis #Graph #Competitor Analysis
-

Vertical Bar Chart Slide for Data Comparison
#Market and Competitor Analysis #Graph #Competitor Analysis
-

Blue Green Graph Numerical Change Analysis – Ideal for Market and Competitive Analysis Presentation
#Market and Competitor Analysis #Diagram #Graph
