Slide Emphasizing Social Service Strengths through Competitive Analysis
RM0700006_8
- Last Update 02/26/2025
- File Size 10.5MB
- # of Slides 2
- File Format PPTX
- Slide Ratio 16:9
- Color
Keywords
- #Content-Based Slides
- #Design-Based Slides
- #Market and Competitor Analysis
- #Graph
- #Text Box
- #Competitor Analysis
- #Competitive Advantage
- #Horizontal Bar
- #Grouped Horizontal Bar
- #Rectangle Text Box
- #16:9
- #competitive analysis chart PowerPoint
- #horizontal bar graph slide
- #market analysis presentation
- #business competitive advantage PPT
- #comparison chart template download
About the Product
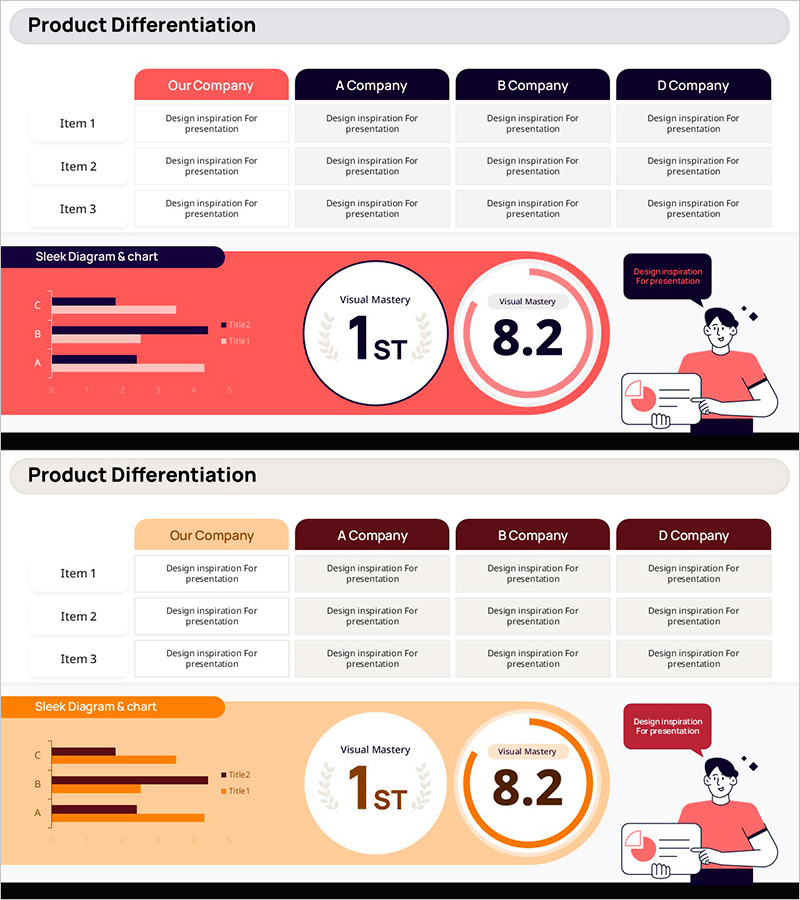
A horizontal bar chart PowerPoint slide that visually emphasizes your company's competitive advantages in social services. This slide compares your company against three competitors across four key metrics (A–D), making it ideal for market analysis and competitive positioning presentations. The red-and-navy color scheme highlights your company's strengths, while circular badges (1ST and 8.2) display both ranking and performance scores simultaneously. The 2-slide set accommodates various data combinations and is optimized for 16:9 widescreen format in PPTX.
Usage Points
-
Main Usage
This slide quantitatively demonstrates your company's competitive edge in social services or B2B solutions. It compares your company (red) against three competitors (navy) across four key performance indicators, clearly highlighting your strengths. Perfect for investor pitches, executive briefings, and marketing strategy presentations requiring credible data visualization.
-
How to Use
Adjust each bar (A–B–C–D) length to match your actual data, and update the legend (Item1·Item2) with your category names. Modify the circular badges with your ranking and score, then the slide is ready for presentation. Colors can be customized to match your corporate branding.
-
Recommended For
Recommended for marketing managers, strategy planners, sales executives, and investor relations teams. Particularly effective for competitive industries like SaaS, fintech, and social platforms when highlighting differentiation. Ideal for quarterly performance reports, new business proposals, and market entry strategy presentations.
-
Slide Structure
Slide 1: Title area + 4-item horizontal bar chart (4 data series: your company, competitors A/B/C) + 2 circular badges (ranking and score) + illustration. Slide 2: Alternative layout with identical structure. All bar lengths, colors, legends, and badge values are fully editable vector-based elements.
Related Products
-

Vertical Bar Chart Slide for Data Comparison
#Market and Competitor Analysis #Graph #Competitor Analysis
-

Visualization of Game Match Result Score – Emphasizing Competitive Advantage
#Market and Competitor Analysis #Diagram #Text Box
-

Carbon Neutral Competitive Advantage Horizontal Chart
#Market and Competitor Analysis #Graph #Competitor Analysis
-

Blue Green Graph Numerical Change Analysis – Ideal for Market and Competitive Analysis Presentation
#Market and Competitor Analysis #Diagram #Graph
