Target Market Share Map Graph – Market Analysis and Strategy
RJ0300062_23
- Last Update 05/05/2025
- File Size 0.1MB
- # of Slides 2
- File Format PPTX
- Slide Ratio 16:9
- Color
Keywords
- #Content-Based Slides
- #Design-Based Slides
- #Market and Competitor Analysis
- #Marketing Plan and Strategy
- #Graph
- #Other
- #Target Market
- #Target Market Strategy
- #Other
- #Other Charts
- #Map
- #16:9
- #world map PowerPoint slide
- #market share map template
- #geographic analysis presentation
- #global market visualization
- #comparative regional slide
About the Product
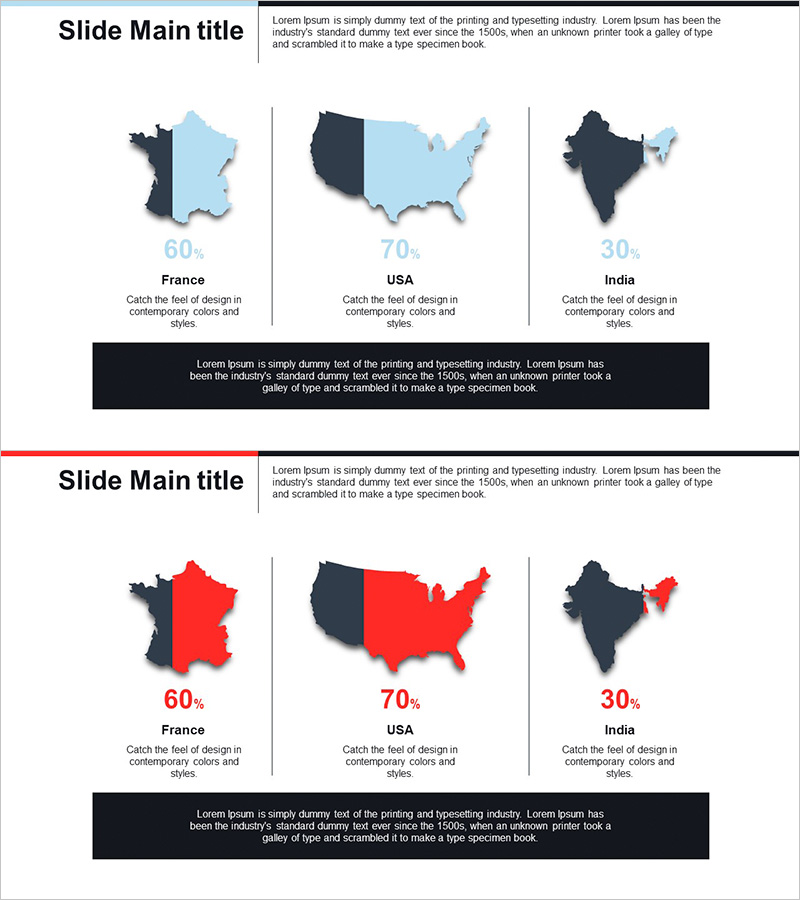
A geographically-focused PowerPoint slide that visualizes global market penetration strategy across three nations. This map-based presentation template displays market share percentages for France, USA, and India using color-coded regions to instantly communicate regional performance. Two color versions—blue tone and red tone—are included, allowing you to align the design with your presentation theme and corporate branding. Each map includes percentage metrics and descriptive text areas below, making it ideal for marketing strategy presentations, market analysis reports, and executive briefings. The 16:9 widescreen format with 2-slide layout is ready to customize and deploy immediately.
Usage Points
-
Main Usage
Communicate regional market penetration and competitive positioning to executives, investors, and stakeholders using map-based visualization. Color-coded geographic emphasis clarifies key markets and growth opportunities, supporting data-driven strategic decisions across global expansion initiatives.
-
How to Use
Open the slide and replace the sample percentages and descriptive text with your actual market data. Select the blue-tone version for presentations emphasizing stability and trust, or the red-tone version for growth and achievement-focused messaging. Insert directly into marketing plans, business reports, and investor presentations.
-
Recommended For
Marketing managers, strategic planning teams, sales executives, and C-suite leaders presenting regional market performance. Particularly effective for multi-country expansion plans, market share comparisons, regional performance analysis, and global growth strategy presentations where geographic context strengthens credibility.
-
Slide Structure
2-slide layout featuring three country maps (France, USA, India) arranged horizontally on each slide. Below each map are percentage metrics (60%, 70%, 30% as examples) and text description areas. Title section at top and unified information box at bottom create clear information hierarchy.
Related Products
-

US Target Market Map for Marketing Analysis
#Market and Competitor Analysis #Marketing Plan and Strategy #Graph
-

Target Country Distribution Graph – Strategic Visualization for Market Analysis
#Market and Competitor Analysis #Marketing Plan and Strategy #Graph
-

Dot Map Graph for Market Analysis Visualization – Strategic Approach
#Market and Competitor Analysis #Marketing Plan and Strategy #Graph
-

European Target Country Analysis Graph – Strategic Market Insights
#Market and Competitor Analysis #Marketing Plan and Strategy #Graph
