Analysis of Eco-Farming Agriculture Distribution by Region in the United States
RJ0600033_23
- Last Update 06/29/2025
- File Size 1.6MB
- # of Slides 2
- File Format PPTX
- Slide Ratio 16:9
- Color
Keywords
- #Content-Based Slides
- #Design-Based Slides
- #Market and Competitor Analysis
- #Marketing Plan and Strategy
- #Other
- #Market Analysis
- #Target Market Strategy
- #Map
- #16:9
- #map infographic PowerPoint
- #US regional analysis slide
- #agriculture distribution map presentation
- #regional data visualization PPT
- #color-coded map template
About the Product
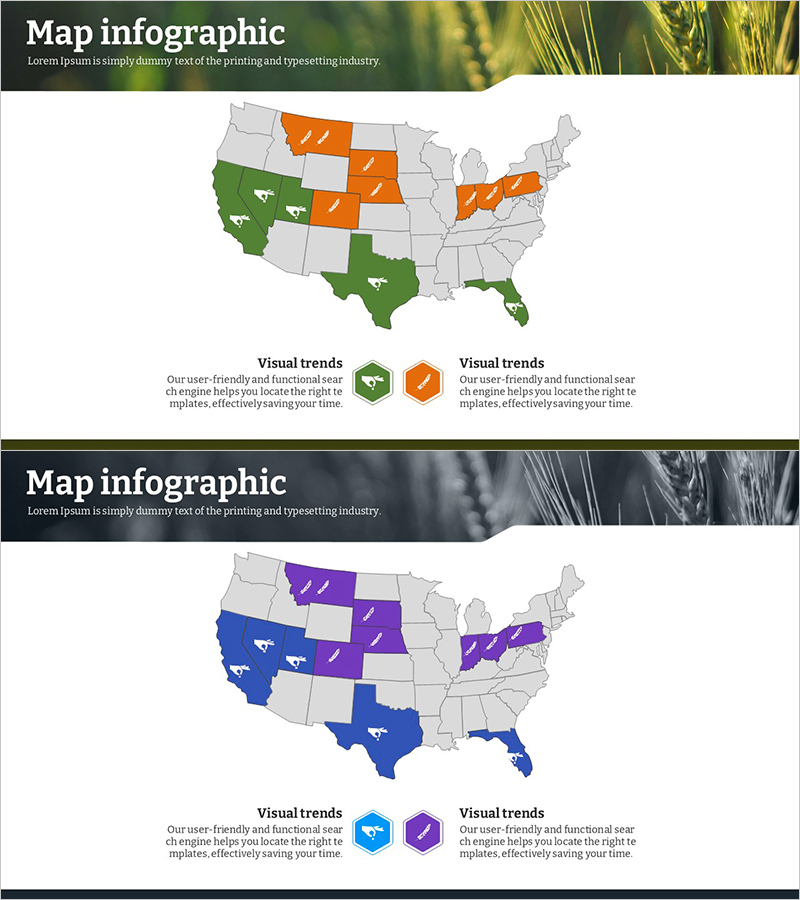
A geospatial visualization slide showing eco-friendly agriculture distribution across the United States by region. The color-coded map uses distinct hues (green and orange in one version, blue and purple in another) to represent agricultural data patterns at a glance. Ideal for market research presentations, agricultural policy briefings, and regional economic reports. Includes two fully editable slides with alternative color schemes to match your presentation theme. PPTX format allows instant customization of regions, data labels, and legend information.
Usage Points
-
Main Usage
Visualize regional agricultural data and market research findings using geographic mapping to support decision-making. Effectively communicate eco-farming trends, investment analysis, and regional economic insights in policy briefings and business reports.
-
How to Use
Insert into the market analysis or current situation section of your presentation to explain regional agricultural distribution patterns intuitively. Include legend and data labels to clarify what each color represents, and add specific regional statistics to enhance credibility and context.
-
Recommended For
Agricultural policy officials, agribusiness companies, eco-farming research institutions, agricultural investment analysts, regional economic report writers, and agricultural marketing professionals presenting data-driven regional insights.
-
Slide Structure
Each slide contains a title area, a full-width map visualization, and two supporting text/legend areas. Both slides share identical layout but feature different color palettes, allowing you to select the scheme that best matches your presentation design.
Related Products
-

U.S. National Renewable Energy Implementation Regional Analysis - Green Mint
#Market and Competitor Analysis #Marketing Plan and Strategy #Other
-

Country Analysis Map Graph for Market Insights
#Market and Competitor Analysis #Marketing Plan and Strategy #Graph
-

Business Forest Wide Template Map3 - Market and Competitive Analysis
#Market and Competitor Analysis #Marketing Plan and Strategy #Other
-

Automobile Market Export Volume Visualization Slide – Market Analysis and Strategy
#Market and Competitor Analysis #Marketing Plan and Strategy #Diagram
