European Target Market Analysis Bar Graph – Market Vision and Opportunities
RJ0400052_19
- Last Update 05/31/2025
- File Size 7.2MB
- # of Slides 2
- File Format PPTX
- Slide Ratio 16:9
- Color
Keywords
- #Content-Based Slides
- #Design-Based Slides
- #Market and Competitor Analysis
- #Graph
- #Other
- #Market Analysis
- #Target Market
- #Horizontal Bar
- #Grouped Horizontal Bar
- #Map
- #16:9
- #European map PowerPoint slide
- #market analysis presentation template
- #horizontal bar chart slide
- #regional data visualization
- #comparative analysis slide download
About the Product
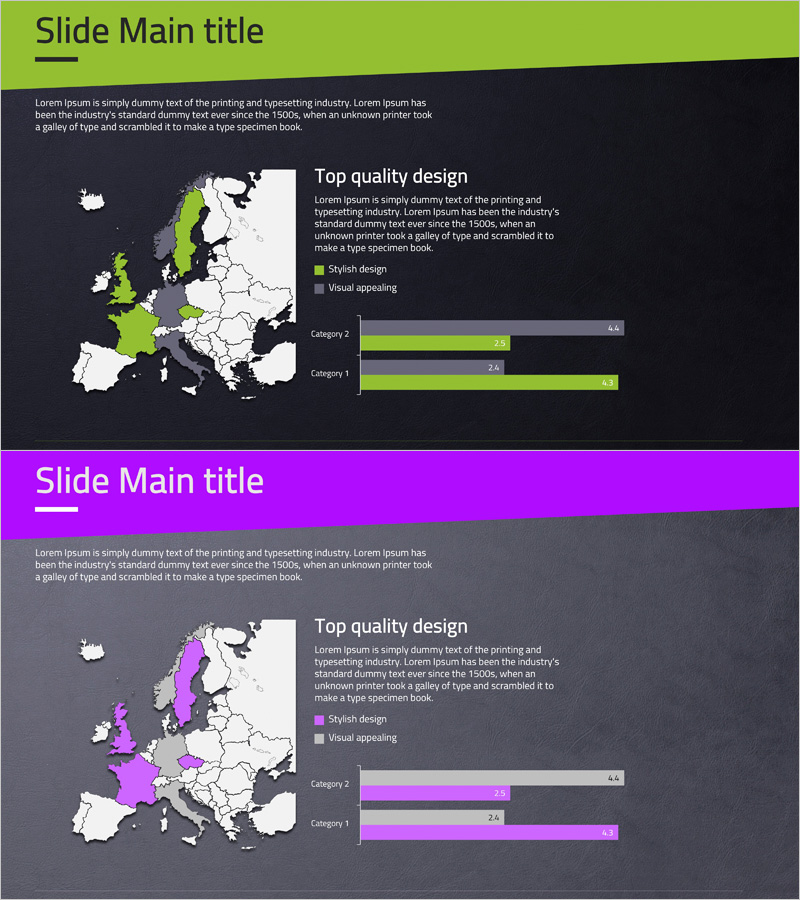
A PowerPoint slide combining a European map with horizontal bar charts to visualize regional market data across two contrasting color themes: lime green and magenta. Each slide highlights target countries on the map while displaying category-wise metrics as horizontal bars on the right side. The 2-slide set provides identical layouts in different color variations, enabling quick adaptation to brand guidelines. Delivered in 16:9 widescreen PPTX format compatible with all presentation software. Ideal for comparative market analysis, regional performance reporting, and international business presentations requiring simultaneous geographic and quantitative insights.
Usage Points
-
Main Usage
Present regional market size, sales volume, market share, or performance metrics across European countries using combined map and bar chart visualization. Simultaneously emphasize geographic location and numerical comparison to strengthen persuasiveness in international business presentations.
-
How to Use
Select your preferred color theme from the slide master, then replace legend labels and numerical values with your data. Synchronize map highlighting with bar lengths to maintain consistent messaging. For maximum comparative impact, arrange both slides side-by-side in scenario comparison sections.
-
Recommended For
Global marketing strategy presentations, international sales reports, regional business planning, investment pitch decks, market research findings, competitive analysis. Suitable for executives, sales teams, marketing professionals, and management consultants presenting region-based business decisions.
-
Slide Structure
Each slide features a European map on the left (color-coded by country), title area in upper right, descriptive text in center right, and two category horizontal bars in lower right (each with 2-3 data series). Map highlight colors align with bar colors for visual coherence and data traceability.
Related Products
-

Target Country Analysis Bar Graph Map – Providing Market Insights
#Market and Competitor Analysis #Graph #Other
-

Scientific and Technological Development Countries Map – Market Analysis and Competitor Insights
#Market and Competitor Analysis #Other #Market Analysis
-

World Map Data Slide | Regional Statistics Visualization PPT
#Market and Competitor Analysis #Marketing Plan and Strategy #Other
-

Science and Technology Observation Target Market – Market Analysis Slide
#Market and Competitor Analysis #Other #Market Analysis
