Gender Ratio Customer Analysis Pie Chart – Emphasizing Customer Insights
RJ0400018_7
- Last Update 05/22/2025
- File Size 0.4MB
- # of Slides 2
- File Format PPTX
- Slide Ratio 16:9
- Color
Keywords
- #Content-Based Slides
- #Design-Based Slides
- #Market and Competitor Analysis
- #Graph
- #Other
- #Customer Analysis
- #Circles
- #Doughnut Chart
- #Silhouette
- #16:9
- #gender ratio pie chart
- #customer analysis silhouette PowerPoint
- #demographic breakdown slide template
- #customer insight infographic
- #gender split data visualization
About the Product
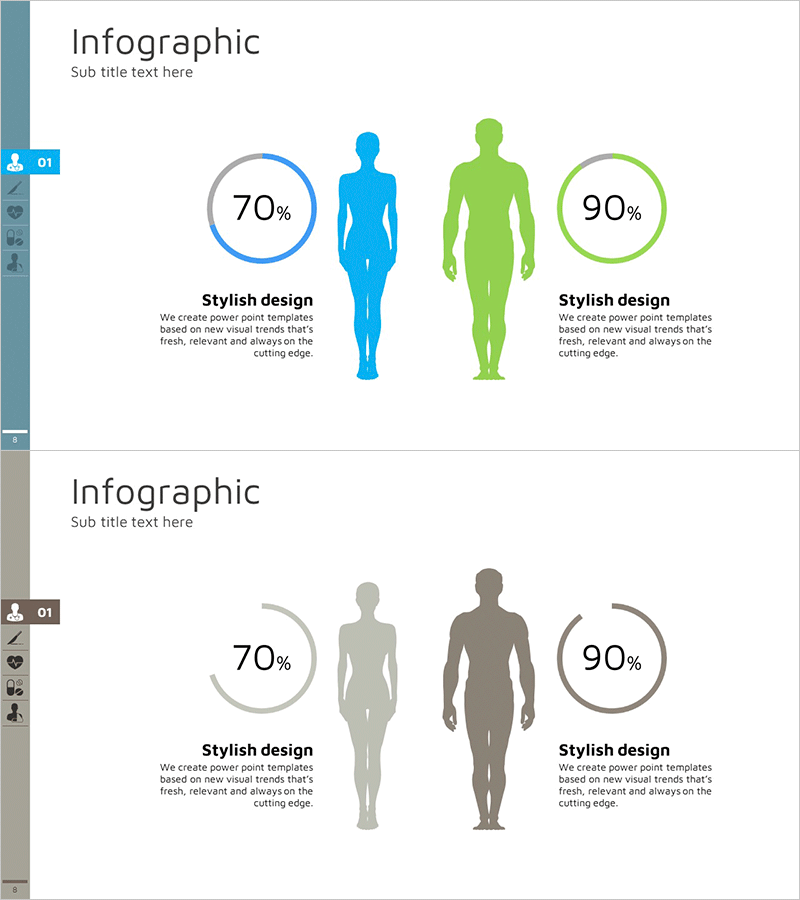
A customer analysis PowerPoint slide combining male and female silhouette figures with pie charts for clear gender ratio visualization. The design uses distinct blue and green color schemes to differentiate demographics, with 70% and 90% data points positioned beneath each silhouette for immediate readability. This 2-slide presentation template enables quick integration into market analysis, customer segmentation, and demographic reporting decks.
Usage Points
-
Main Usage
Designed to visualize gender-based customer distribution in market analysis presentations. The silhouette-and-chart combination communicates demographic composition intuitively, making it ideal for marketing strategy sessions and executive briefings on target audience profiles.
-
How to Use
Input gender-specific percentages beneath each silhouette on Slide 1, then update the corresponding pie chart segments. Slide 2 allows you to replicate the structure for additional customer segments (age groups, regions, purchase tiers) to create comparative demographic analysis.
-
Recommended For
Marketing teams conducting customer segmentation analysis, sales teams presenting target audience composition, and executives reviewing customer insights. Particularly effective for consumer goods, financial services, retail, and telecommunications industry presentations.
-
Slide Structure
2-slide layout with symmetrical design: left side features blue female silhouette with 70% pie chart, right side shows green male silhouette with 90% pie chart. Each silhouette includes descriptive text area below. 16:9 widescreen format optimized for modern presentation environments.
Related Products
-

Work Performance Analysis Graph – Visually Representing Employee Performance
#Market and Competitor Analysis #Graph #Other
-

Soccer Game Illustration Graph for Market and Competitive Analysis
#Business Strategy #Market and Competitor Analysis #Graph
-

User Analysis Donut Chart – Optimal for Market and Competitor Analysis
#Market and Competitor Analysis #Graph #Other
-

Silhouette Diagram & Circle Donut Graph – Visual Tool for Customer Analysis
#Product/Service Introduction #Market and Competitor Analysis #Graph
