Mobile App Competitor Analysis – Visualizing Market Share
RJ0400048_6
- Last Update 05/30/2025
- File Size 0.5MB
- # of Slides 2
- File Format PPTX
- Slide Ratio 16:9
- Color
Keywords
- #Content-Based Slides
- #Design-Based Slides
- #Market and Competitor Analysis
- #Graph
- #Other
- #Competitor Analysis
- #Competitive Advantage
- #Line
- #Line Chart
- #16:9
- #line chart PowerPoint
- #trend analysis slide template
- #competitor comparison chart
- #market share visualization
- #dual-series data PowerPoint
- #how to create line chart in PowerPoint
About the Product
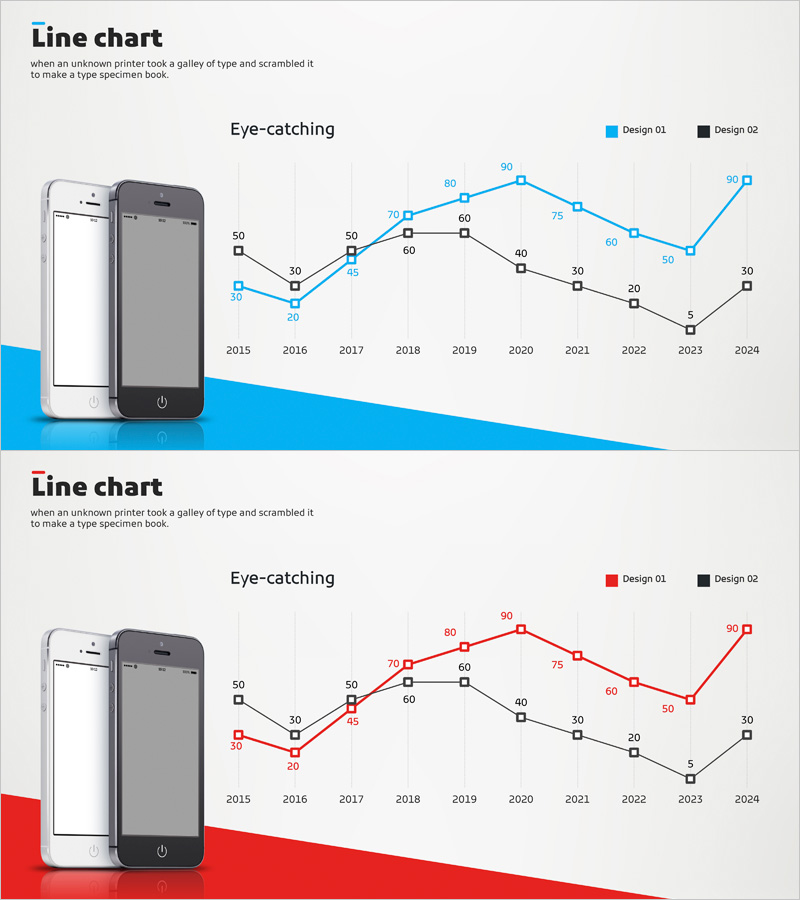
A line chart PowerPoint slide that visualizes mobile app competitor market share trends from 2015 to 2024. This presentation template displays two data series side-by-side, making it ideal for competitive analysis, market trend analysis, and performance comparison presentations. The slide offers two design options in blue and black color schemes, with data point labels for precise information delivery. Compatible with modern presentation environments in 16:9 widescreen PPTX format, ready for immediate use in business reports and investor pitches.
Usage Points
-
Main Usage
Visualizes changes in competitor market share, product performance trends, revenue, and user growth over time across two or more data series. Enables executives, investors, and stakeholders to quickly grasp rising and falling trends in key metrics during board reports, investor presentations, and marketing analysis meetings.
-
How to Use
Open the slide and replace existing data values with your own figures for immediate use. Modify the legend labels (Design 01, Design 02) to reflect product names or competitor names, and adjust the X-axis years and Y-axis scale range to fit your market analysis data.
-
Recommended For
Marketing managers, executives, business development teams, consultants, and data analysts presenting competitive analysis, market research, and performance reports. Particularly valuable in industries where market share tracking is critical, such as mobile apps, SaaS, fintech, and retail.
-
Slide Structure
Dual-series line chart with X-axis spanning 2015–2024 (10 years) and Y-axis scaled 0–90. Each series connects 10 data points with numeric labels at each point. Two design variations in blue and black color schemes are included for visual flexibility.
Related Products
-

Korea China Japan Analysis Graph – Market Competitive Advantage
#Market and Competitor Analysis #Graph #Other
-

Internet Shopping Market Comparative Analysis Graph
#Market and Competitor Analysis #Graph #Competitor Analysis
-

Competitor Revenue Analysis Graph
#Market and Competitor Analysis #Graph #Competitor Analysis
-

Big Data Analysis Line Graph – Visualizing Competitive Advantage
#Market and Competitor Analysis #Graph #Competitor Analysis
