Modern Theme Competitor Analysis Graph
RJ0300047_10
- Last Update 05/01/2025
- File Size 3.5MB
- # of Slides 2
- File Format PPTX
- Slide Ratio 16:9
- Color
Keywords
- #Content-Based Slides
- #Design-Based Slides
- #Market and Competitor Analysis
- #Graph
- #Competitor Analysis
- #Competitive Advantage
- #Line
- #Line Chart
- #16:9
- #line chart PowerPoint slide
- #dual series trend analysis
- #time series data visualization
- #competitor analysis graph
- #sales performance PowerPoint template
About the Product
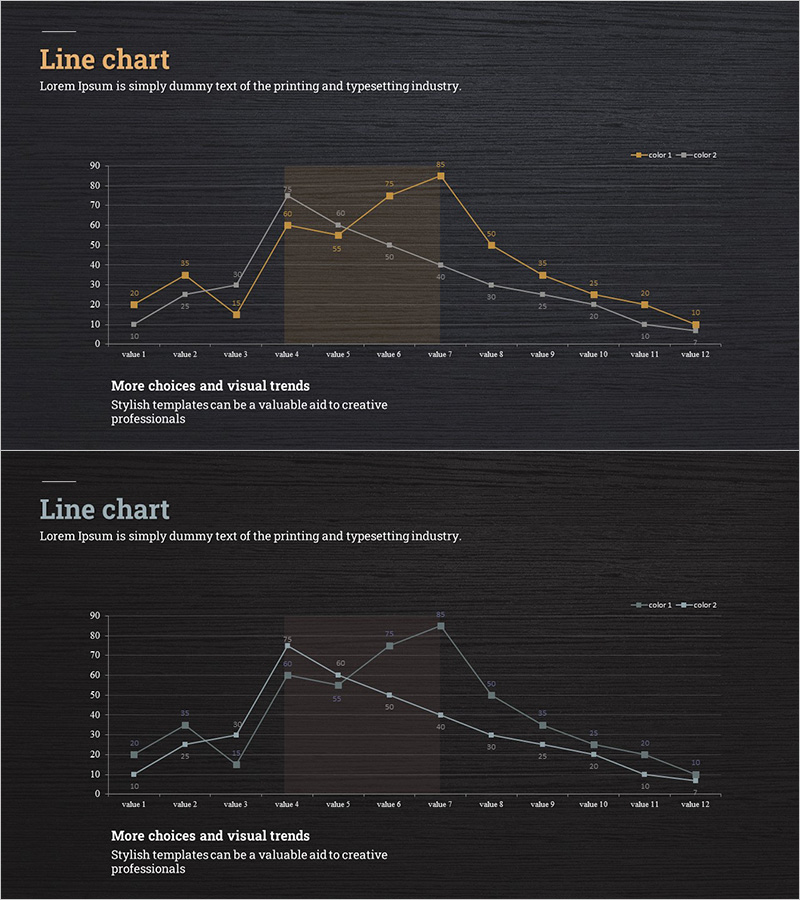
A dual-series line chart PowerPoint slide featuring a dark background with gold accent points. This presentation template visualizes two data series across 12 time periods, enabling clear comparison of trends and performance metrics. Ideal for competitor analysis, market trends, sales performance, and quarterly reviews. The 16:9 widescreen format includes 2 slides ready for immediate use, with fully editable colors, data values, and labels for seamless customization.
Usage Points
-
Main Usage
Compares two data series over time to reveal performance trends and patterns. Commonly used for competitive benchmarking, market share evolution, quarterly revenue tracking, customer satisfaction trends, and strategic performance monitoring to support data-driven decision-making.
-
How to Use
Replace the 12 data points and numerical values with your actual data. Customize the gold and gray series colors to match your brand guidelines, and edit the legend, axis labels, and title as needed. The dark background ensures excellent visibility in projector environments and on large screens.
-
Recommended For
Executive reports, quarterly business reviews, market analysis presentations, competitive benchmarking meetings, investor relations materials, and strategic planning sessions. Suitable for marketing teams, sales departments, business planning units, finance teams, and any department requiring data-driven presentations.
-
Slide Structure
Both slides feature identical line chart layouts with a Y-axis range (0–90), X-axis with 12 intervals (value 1–12), dual series (gold and gray lines), legend, and title area. Data point labels display numerical values for precise reference and easy interpretation.
Related Products
-

Variation Graph for the Line Chart – Optimized Design for Market and Competitor Analysis
#Market and Competitor Analysis #Graph #Competitor Analysis
-

Simple Cement Theme Broken Line Graph – Market and Competitor Analysis
#Market and Competitor Analysis #Graph #Competitor Analysis
-

Business Competitor Analysis Graph
#Market and Competitor Analysis #Graph #Competitor Analysis
-

Competitor Comparison Analysis Graph - Highlighting Competitive Advantage
#Market and Competitor Analysis #Graph #Competitor Analysis
