Online Business Marketing Strategy – Data-Driven Decision Making
RJ0600032_25
- Last Update 06/29/2025
- File Size 1.7MB
- # of Slides 2
- File Format PPTX
- Slide Ratio 16:9
- Color
Keywords
- #Content-Based Slides
- #Design-Based Slides
- #Product/Service Introduction
- #Marketing Plan and Strategy
- #Graph
- #Other
- #Development Status
- #Marketing Strategy
- #Circles
- #Doughnut Chart
- #Mockup
- #16:9
- #laptop mockup PowerPoint slide
- #device mockup presentation template
- #pie chart mockup slide
- #marketing presentation slide
- #data visualization mockup download
About the Product
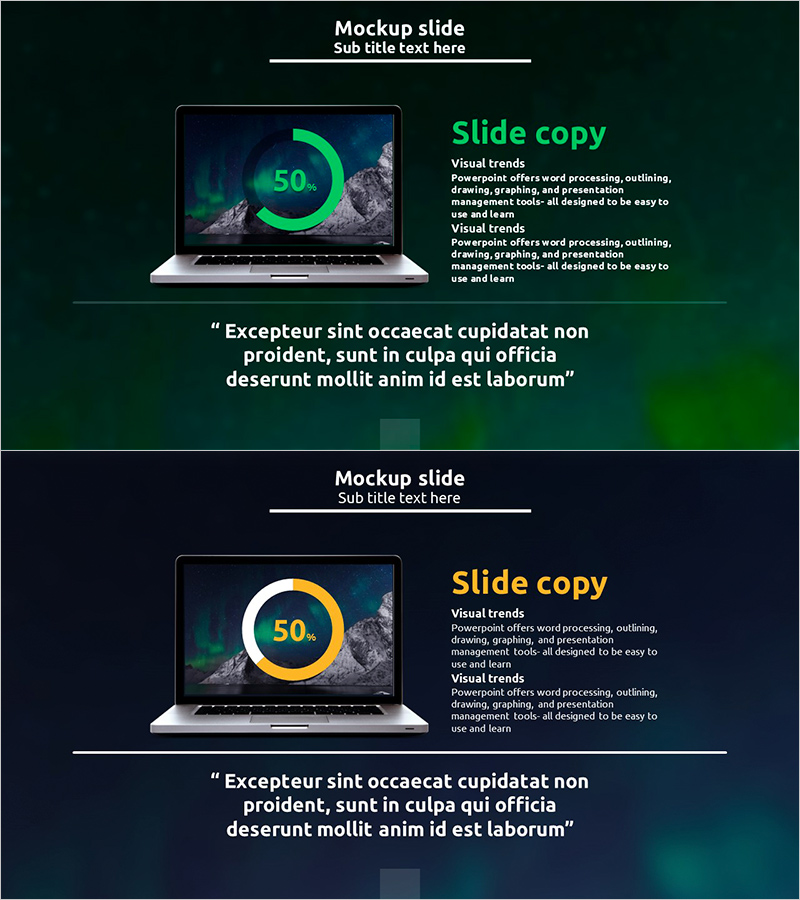
A device mockup PowerPoint slide set featuring a laptop screen displaying a 50% pie chart in green and yellow color variants. This 2-slide presentation template showcases a minimalist dark background design with the laptop image and chart positioned on the left, while the right side provides ample space for text content. Ideal for marketing strategy presentations, online business analysis, and data-driven decision-making reports. The 16:9 widescreen PPTX format allows for immediate editing and customization to match your presentation needs.
Usage Points
-
Main Usage
This mockup slide template displays data visualization on a laptop screen, effectively communicating online business strategies, marketing performance, and analytical insights. The 50% pie chart can represent various metrics including achievement rates, market share, conversion ratios, and performance benchmarks.
-
How to Use
Insert this slide into the data visualization or results section of your presentation to showcase real-world dashboard implementations or analytics tools. Use the right-side text area to add analysis findings, key insights, recommendations, and action plans that complement the visual representation.
-
Recommended For
Marketing professionals, data analysts, online business strategists, and executives preparing performance reports will find this template valuable for presenting marketing metrics, digital channel analysis, customer data insights, and strategic decision-making frameworks.
-
Slide Structure
The 2-slide set features a consistent layout with the laptop mockup positioned on the left side displaying the pie chart, and a dedicated text area on the right for titles and descriptions. Both green and yellow color variants are included, allowing flexibility in matching your presentation's visual theme and tone.
Related Products
-

Five Color PowerPoint Template Wide – Donut Chart
#Product/Service Introduction #Business Vision and Strategy #Graph
-

Data Status Analysis Pie Chart – Intuitive Visualization
#Product/Service Introduction #Graph #Other
-

Technology Achievement Donut Chart
#Product/Service Introduction #Business Introduction #Graph
-

Equipment Demand Survey with Donut Chart – Data Visualization
#Product/Service Introduction #Graph #Other
