Gauge Charts by Region – Market Analysis and Competitiveness
RJ0600037_23
- Last Update 06/30/2025
- File Size 0.8MB
- # of Slides 2
- File Format PPTX
- Slide Ratio 16:9
- Color
Keywords
- #Content-Based Slides
- #Design-Based Slides
- #Market and Competitor Analysis
- #Graph
- #Other
- #Market Analysis
- #Target Market
- #Horizontal Bar
- #Segmented Horizontal Bar
- #Map
- #16:9
- #world map PowerPoint slide
- #gauge chart by region
- #market analysis presentation
- #country comparison chart
- #competitive analysis slide
About the Product
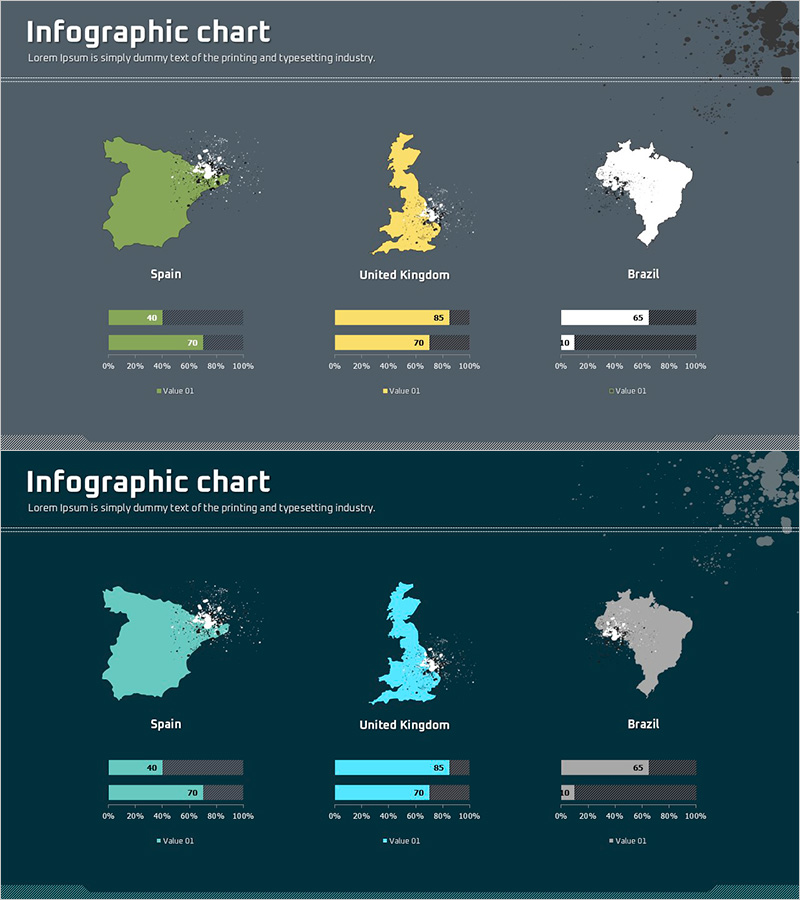
A PowerPoint slide that visualizes market competitiveness across Spain, United Kingdom, and Brazil using world maps and gauge charts. Each country map is displayed in distinct colors (lime green, yellow, white) with corresponding gauge charts below showing two data metrics (Value Q1, Value Q2) on a 0–100% scale. Set against a dark gray background with white typography for strong contrast, this slide deck is ready to use for international market analysis, regional performance comparison, and competitive benchmarking presentations.
Usage Points
-
Main Usage
Visualize international market analysis and regional competitiveness comparison. This slide combines geographic information from world maps with quantitative gauge chart data, enabling stakeholders to understand global business performance at a glance.
-
How to Use
Enter country names in the map regions and update the gauge chart values with your actual data. Customize colors to match your brand identity. Use in international business meetings, investor presentations, and market research reports.
-
Recommended For
Global marketing managers, business development professionals, market analysts, executive report writers, international sales teams, and consulting firm analysts who need to compare regional and country-level data.
-
Slide Structure
2-slide layout: Slide 1 features dark gray background; Slide 2 uses dark teal background. Each slide displays 3 country maps (Spain, United Kingdom, Brazil) with corresponding 2-metric gauge charts (0–100% scale, dual-series data visualization). 16:9 widescreen format optimized for modern presentation environments.
Related Products
-

Target Country Year-by-Year Analysis Chart – Data Visualization for Market Analysis
#Market and Competitor Analysis #Graph #Other
-

Target Market Analysis Data Table - Market Growth Statistics
#Market and Competitor Analysis #Graph #Other
-

Asia Target Market Analysis Graph – Tremendous Visual Appeal
#Market and Competitor Analysis #Graph #Other
-

US Target Region Analysis Graph – Visualizing Market Status
#Market and Competitor Analysis #Graph #Other
