Premium Presentation Slide Visualized with Gradient Donut Chart
RJ0200060_6
- Last Update 04/16/2025
- File Size 0.2MB
- # of Slides 2
- File Format PPTX
- Slide Ratio 16:9
- Color
Keywords
- #Content-Based Slides
- #Design-Based Slides
- #Product/Service Introduction
- #Business Introduction
- #Diagram
- #Graph
- #Composition
- #Technological Status
- #Spread
- #Circles
- #Radial Diagram
- #Doughnut Chart
- #16:9
- #donut chart PowerPoint slide
- #pie chart template download
- #3-segment ratio visualization
- #circular graph presentation
- #gradient chart design
- #how to create donut chart in PowerPoint
About the Product
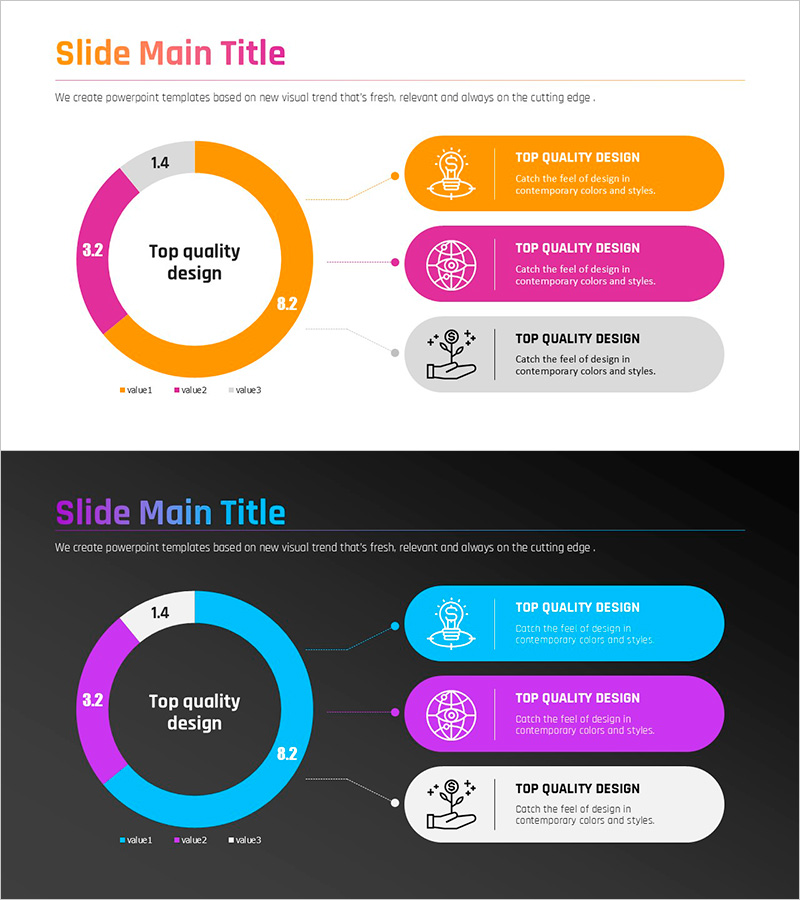
A PowerPoint slide featuring a three-segment donut chart with a central circular area for key messaging and gradient-colored sections in orange, pink, and blue. Connected callout boxes with icons provide detailed explanations for each segment, making it ideal for comparing market share, product composition, or organizational capabilities. The 2-slide set includes both light and dark background versions, with fully editable numbers, labels, and colors for immediate use in business presentations.
Usage Points
-
Main Usage
Compares and visualizes the proportion, composition, or market share of three key elements at a glance. The central circular area emphasizes the core message while the donut segments and callout boxes clearly communicate numerical data and descriptions for each item.
-
How to Use
Apply to market analysis slides for competitor share comparison, product introduction sections for feature composition ratios, or organizational slides for departmental capability distribution. Choose between light or dark background versions based on presentation environment and edit numbers and labels for immediate deployment.
-
Recommended For
Recommended for marketing professionals, planners, analysts, and executives who need to explain quantitative data intuitively. Suitable for business plans, proposals, investor pitches, marketing strategies, and market analysis reports.
-
Slide Structure
Two-slide set with Slide 1 featuring a light background (white/gray) and Slide 2 with a dark background (black). Each slide contains a central donut chart (3 segments), three callout boxes with icons on the right, and a legend at the bottom. All numbers, labels, and colors are fully editable.
Related Products
-

Space Industry Development Status Graph – Capturing the Future of Industry
#Product/Service Introduction #Business Introduction #Graph
-

Violin Donut Chart – Effective Data Visualization
#Product/Service Introduction #Business Introduction #Graph
-

Big Data Comprehensive Analysis Chart – Insights for Market Analysis
#Business Introduction #Market and Competitor Analysis #Diagram
-

Service Technology Analysis Circle Graph – Market Analysis and Technology Status
#Business Introduction #Market and Competitor Analysis #Diagram
