Content Composition Breakdown by Year with Horizontal Bar Chart
RJ0300044_17
- Last Update 04/29/2025
- File Size 0.2MB
- # of Slides 2
- File Format PPTX
- Slide Ratio 16:9
- Color
Keywords
- #Content-Based Slides
- #Design-Based Slides
- #Business Introduction
- #Market and Competitor Analysis
- #Graph
- #Technological Status
- #Market Analysis
- #Horizontal Bar
- #Segmented Horizontal Bar
- #16:9
- #horizontal bar chart PowerPoint
- #year-over-year comparison slide
- #stacked bar graph template
- #data visualization PPT
- #content composition chart
- #PowerPoint slide design
About the Product
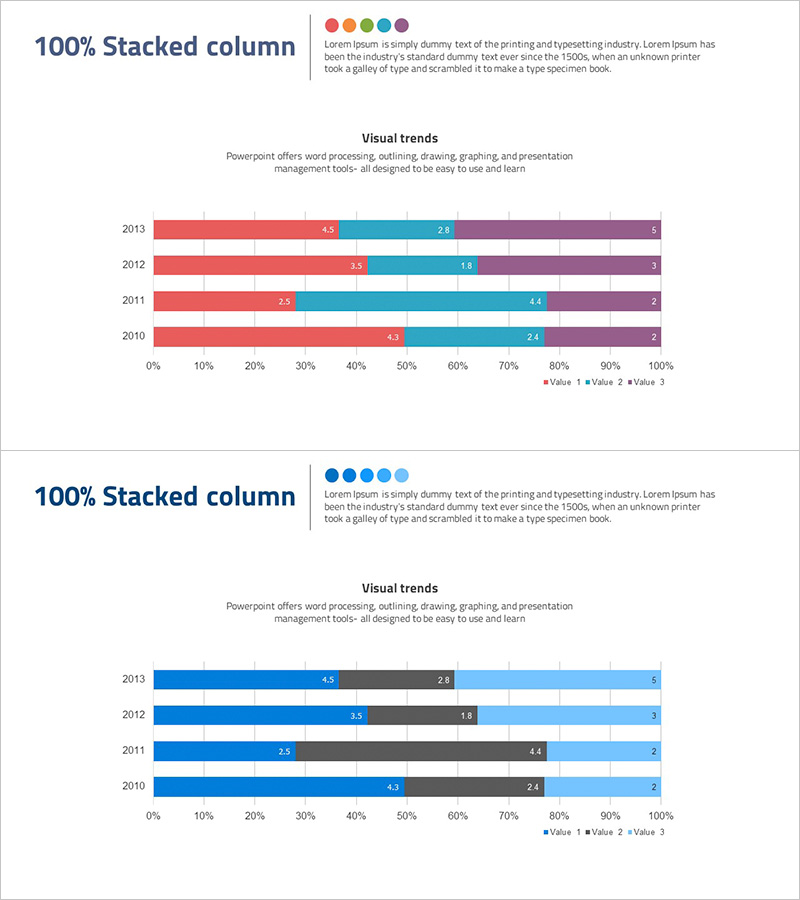
A horizontal stacked bar chart PowerPoint slide comparing content composition across four years (2010–2013) with four data categories. The chart uses three distinct colors (red, blue, purple) to differentiate values, displaying 100% stacked bars that clearly show proportional changes over time. Each year's bar is labeled with numerical values for easy reference. Perfect for marketing reports, business analysis presentations, and market trend discussions. Delivered in 16:9 widescreen format, fully editable PPTX file compatible with all PowerPoint versions.
Usage Points
-
Main Usage
Ideal for comparing multi-year trends and proportional changes simultaneously. The 100% stacked bar format allows viewers to assess both absolute changes and relative composition shifts across four consecutive years, making it perfect for trend analysis and performance tracking.
-
How to Use
Insert into marketing reports, business performance presentations, or quarterly review decks. Double-click the chart to edit data values directly; the visualization updates automatically. Customize colors, labels, and legend text to match your brand or presentation theme without affecting the chart structure.
-
Recommended For
Marketing teams presenting market share evolution, executives reviewing annual business metrics, consulting firms analyzing industry trends, educational institutions showing enrollment composition, and manufacturers displaying product line distribution over time.
-
Slide Structure
Two-slide deck with a title slide and a data visualization slide. The chart displays four years (2010–2013) on the vertical axis with four data categories represented in red, blue, and purple. Each stacked bar extends to 100%, with numerical labels positioned on each segment for clarity and precision.
Related Products
-

4-Step Business Process Graph – Market Analysis and Technology Status
#Business Introduction #Market and Competitor Analysis #Graph
-

Visualizing Current Internet Shopping Payment Technologies with Horizontal Bar Graph
#Business Introduction #Market and Competitor Analysis #Graph
-

Business Sector Analysis Chart – Multifaceted Visualization
#Business Introduction #Market and Competitor Analysis #Diagram
-

Business Area Analysis Graph & PC Mockup
#Technical Approach #Market and Competitor Analysis #Graph
