Innovative Chart Slide Featuring AI Theme
RJ0700025_23
- Last Update 07/29/2025
- File Size 1.3MB
- # of Slides 2
- File Format PPTX
- Slide Ratio 16:9
- Color
Keywords
- #Content-Based Slides
- #Design-Based Slides
- #Financial Plans and Performance
- #Diagram
- #Income Statement
- #Key Financial Indicators
- #Table
- #Standard Table
- #16:9
- #table PowerPoint slide
- #data table template
- #4-column table design
- #financial data slide
- #comparison analysis chart
- #PowerPoint table download
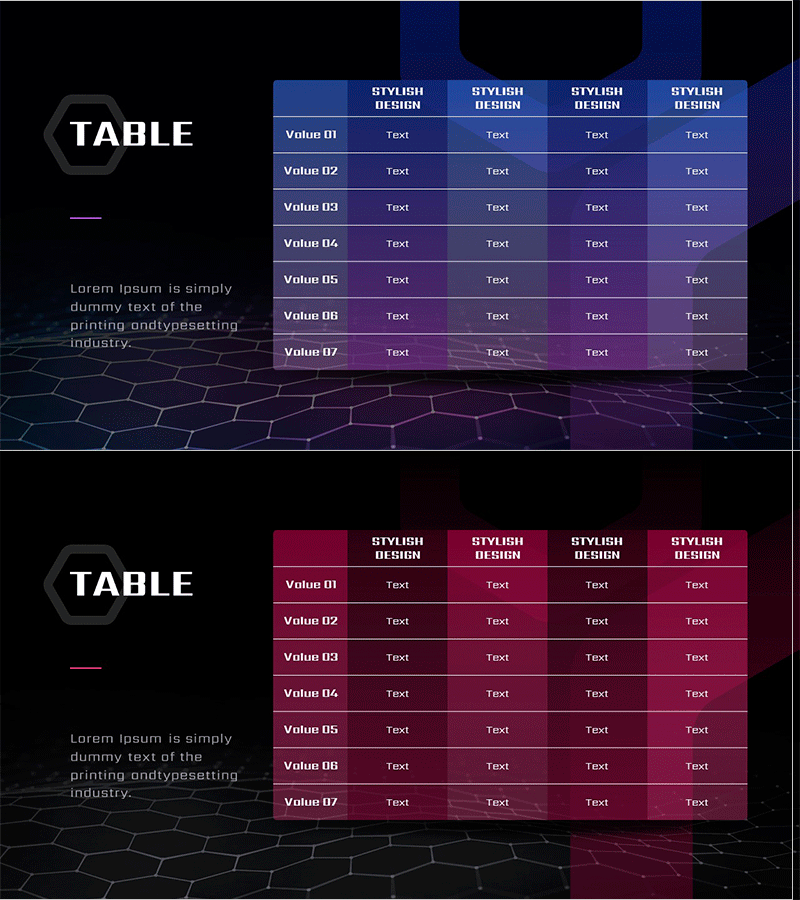
About the Product
A 2-slide table template set featuring an AI theme with dual-color versions: blue and wine tones. Each slide contains a 7-row by 4-column data input grid with hexagon-shaped left labels and hexagonal background pattern for a technical, contemporary aesthetic. Ideal for presenting financial performance, profit-and-loss statements, comparative analysis, and numerical data in PowerPoint presentations. Delivered in 16:9 widescreen format with fully editable text and color elements to match your corporate branding.
Usage Points
-
Main Usage
Present financial performance metrics, profit-and-loss statements, sales figures, departmental KPIs, and comparative data in a structured, easy-to-read table format. Clear row and column divisions facilitate quick data comparison and analysis during presentations.
-
How to Use
Input numerical values, text, percentages, or other data into each cell for use in financial reports, quarterly earnings presentations, investor relations meetings, and executive briefings. Blue version conveys trust and professionalism; wine version emphasizes importance and draws attention.
-
Recommended For
CFOs, financial analysts, executives, marketing managers, and project leaders who rely on data-driven decision-making. Suitable for quarterly results announcements, annual performance reviews, budget planning sessions, and competitive benchmarking presentations.
-
Slide Structure
2-slide set: Slide 1 (blue version) features header row with 4 columns plus 7 data rows; Slide 2 (wine version) maintains identical structure. Each cell is independently editable, and hexagon background patterns and left labels are on separate layers for color customization.
Related Products
-

Table of Key Financial Indicators to Highlight
#Financial Plans and Performance #Diagram #Income Statement
-

Insight Summary Table – Visualizing Financial Plans and Performance
#Financial Plans and Performance #Diagram #Income Statement
-

Key Financial Indicators Table – Trust and Professionalism
#Financial Plans and Performance #Diagram #Income Statement
-

Leather Material Presentation Template Table Chart – Financial Performance Visualization
#Financial Plans and Performance #Diagram #Income Statement
