Vertical Bar Chart for Data Analysis – Business Insights
RJ0700021_25
- Last Update 07/28/2025
- File Size 0.4MB
- # of Slides 2
- File Format PPTX
- Slide Ratio 16:9
- Color
Keywords
About the Product
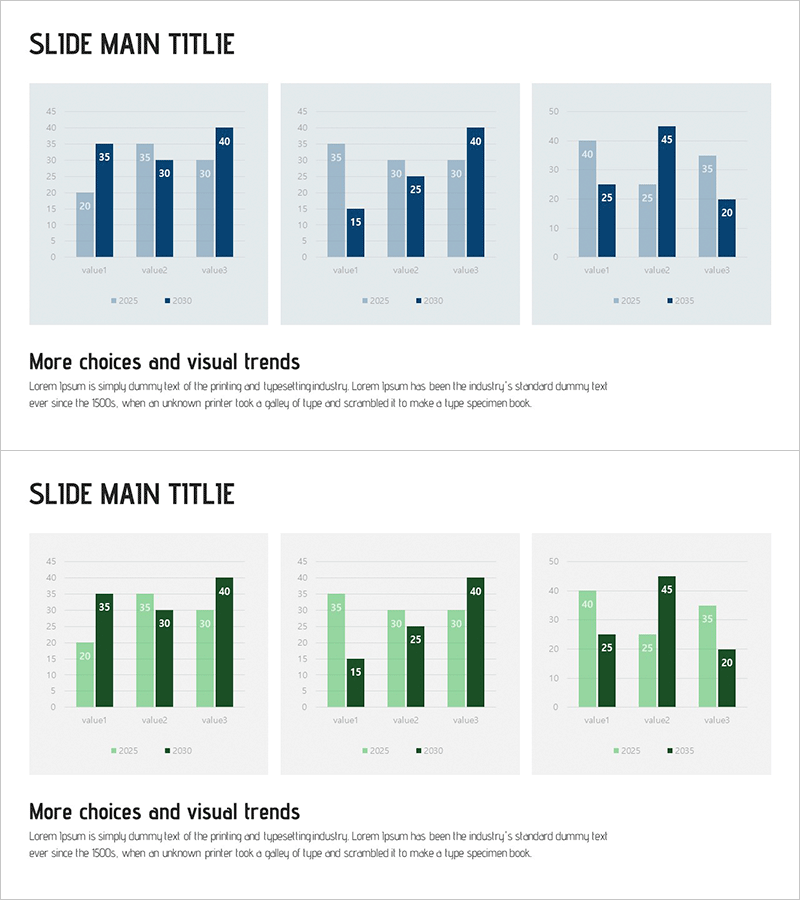
This free PowerPoint slide features three grouped vertical bar charts arranged in a clean three-column grid layout, making it easy to compare data across multiple years such as 2025, 2030, and 2035. Two color versions are included: a navy and steel-blue palette for a professional corporate look, and a dark-green and light-green palette for a fresh, growth-oriented feel. Each bar displays a numeric label directly on the bar, ensuring strong readability without extra annotation. A title and description text area at the bottom of the slide allows you to add data interpretation or key takeaways. This single slide is ready to drop into a business plan, investor pitch deck, market analysis report, or financial performance presentation. Simply replace the numbers, legend years, and supporting text to make it your own. For a wider collection of chart and graph slides, explore GoodPello's premium graph slide library.
Usage Points
-
Main Usage
Designed to visually compare year-over-year numerical data across three categories using side-by-side grouped vertical bar charts, making growth trends and value differences immediately clear to any audience.
-
How to Use
Replace the numeric values on each bar, update the legend years to match your data range, and enter your data interpretation text in the title and description area at the bottom of the slide.
-
Recommended For
Business planners, startup founders, consultants, and analysts who need to present multi-year growth forecasts, financial metrics, or market size comparisons in pitch decks, business plans, or strategy reports.
-
Slide Structure
1-slide layout with three grouped vertical bar charts in a 3-column grid, two-tone bar pairs per chart, numeric labels on each bar, and a title plus description text block at the bottom. Available in navy/steel-blue and dark-green/light-green color versions.
Related Products
-

Comparative Analysis Bar Graph – Market and Competitor Analysis
#Free Graphs
-

Tree Yellow Purple Area Chart – Innovation in Data Visualization
#Free Graphs
-

Market Analysis Graph – Harmony of Pink and Bluegreen
#Free Graphs
-

Business Comparison Analysis Graph – Strengthening Market and Competitor Analysis
#Free Graphs
