Business Activity Areas Diagram – Visual Design for Business Success
RM0300003_6
- Last Update 02/07/2025
- File Size 0.3MB
- # of Slides 2
- File Format PPTX
- Slide Ratio 16:9
- Color
Keywords
- #Content-Based Slides
- #Design-Based Slides
- #Company Introduction
- #Business Introduction
- #Diagram
- #Business Areas
- #Business Areas
- #Cluster
- #Spread
- #Chain Diagram
- #Centralized Diagram
- #16:9
- #radial diagram PowerPoint slide
- #center focus diagram template
- #business areas presentation
- #6-item cluster diagram
- #organizational structure slide
- #how to create radial diagram in PowerPoint
About the Product
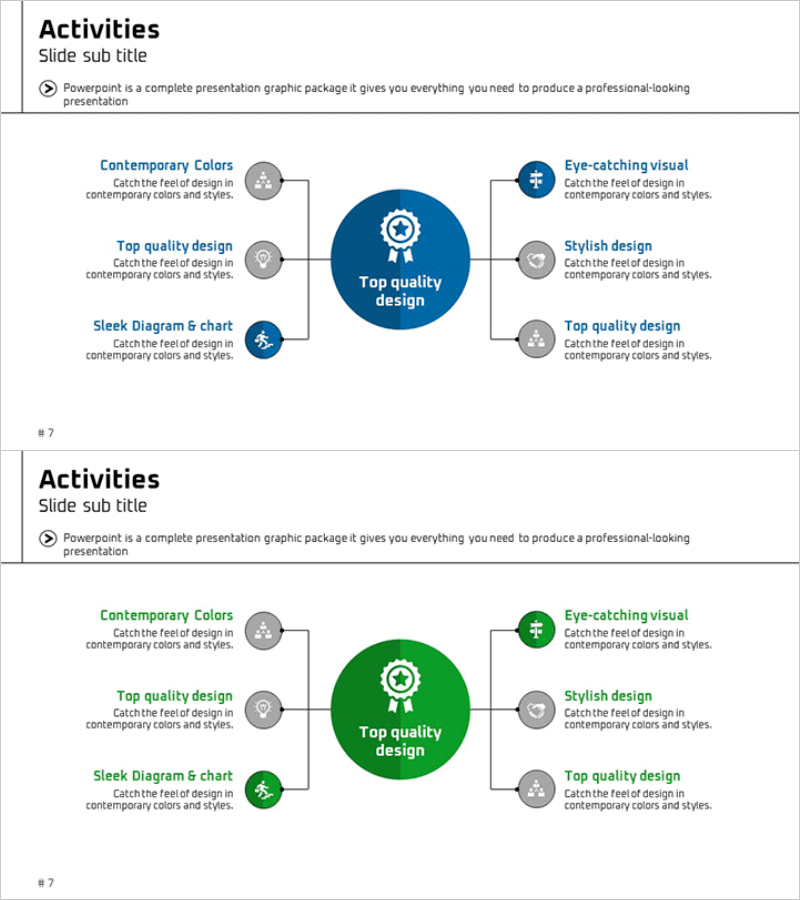
A radial diagram PowerPoint slide featuring a central concept radiating outward to six surrounding nodes. The design uses a dark blue center circle with gray peripheral nodes, each containing icons and text areas for describing business activities, organizational roles, or success factors. Perfect for company introductions, business overviews, and strategic presentations. Includes two color variations—blue and green versions—on 2 slides in 16:9 widescreen PPTX format. All elements are fully editable for immediate customization and deployment.
Usage Points
-
Main Usage
Visually represent core concepts, business divisions, or success factors radiating from a central hub. Ideal for explaining organizational structure, strategic priorities, business models, and interconnected relationships in executive presentations, investor pitches, and team briefings.
-
How to Use
Enter your core concept (company name, mission, strategic goal) in the center circle. Add six key items (business units, departments, success factors, or roles) to the surrounding nodes. Customize icons to match your industry and edit text fields. Use both color versions for variety across multiple slides.
-
Recommended For
Executive strategy presentations, investor relations and pitch decks, company onboarding and orientation, organizational restructuring announcements, marketing team customer journey mapping, consulting firms presenting business models, startups explaining business plans and value propositions.
-
Slide Structure
Slide 1: Dark blue background with central blue circle (icon included) and 6 gray nodes in radial arrangement (each with icon and editable text area). Slide 2: Identical layout with green center circle. All shapes, colors, icons, and text are fully editable and can be resized or repositioned.
Related Products
-

Mobile Security Service Diagram
#Company Introduction #Business Introduction #Diagram
-

Circular Linked Infographic Network – Infographic for Business Introduction
#Company Introduction #Business Introduction #Diagram
-

Mobile App Service Activity Area – Harmonizing Business and Design
#Company Introduction #Business Introduction #Diagram
-

Astronomy Business Sector Diffusion Diagram
#Company Introduction #Business Introduction #Diagram
