Financial Business Area Circular Diagram – Effective Visualization for Business Introduction
RJ0300094_10
- Last Update 05/15/2025
- File Size 0.5MB
- # of Slides 2
- File Format PPTX
- Slide Ratio 16:9
- Color
Keywords
- #Content-Based Slides
- #Design-Based Slides
- #Company Introduction
- #Business Introduction
- #Diagram
- #Business Areas
- #Business Areas
- #Cluster
- #Spread
- #Chain Diagram
- #Centralized Diagram
- #16:9
- #radial diagram PowerPoint
- #8-section circular diagram
- #business area PowerPoint slide
- #center-based diagram
- #company introduction PPT slide
About the Product
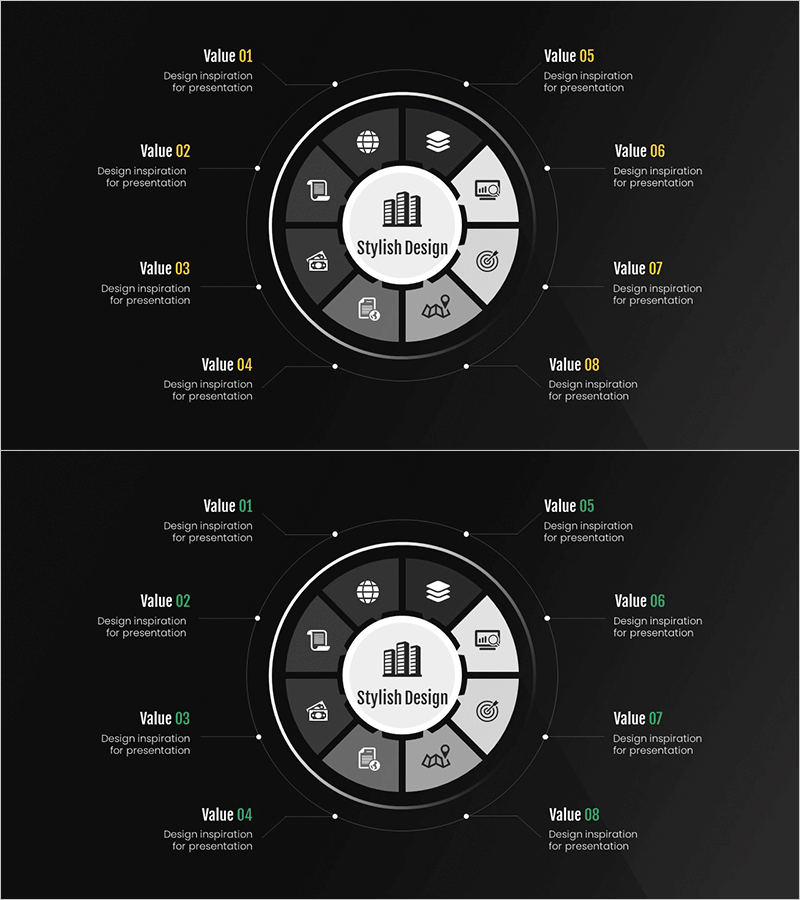
A PowerPoint slide featuring a radial diagram with eight sections extending from a central circle. Set against a dark gray background with white borders and icons, each segment clearly represents business categories, financial domains, or organizational functions. The 2-slide set includes a matching layout variation for immediate use across multiple presentation scenarios. This design effectively communicates how core concepts relate to surrounding elements, making it ideal for visualizing complex business structures and hierarchical information in presentations.
Usage Points
-
Main Usage
Represents core business functions, financial product categories, or business domain classifications by radiating from a central concept to surrounding elements. Ideal for company introductions, business overviews, and organizational structure explanations where complex information needs hierarchical presentation.
-
How to Use
Enter the central concept (e.g., company name or business division) and populate the eight sections with corresponding details (departments, products, functions). Edit icons and text labels to match your presentation content. Both slides share the same structure, allowing flexible reuse across multiple topics.
-
Recommended For
Financial, banking, and insurance industry company presentations; multi-departmental organizational function explanations; corporate portfolio introductions for diversified business areas; consulting proposal solution classifications; marketing strategy presentations for target segment analysis.
-
Slide Structure
Central circular hub (text input area) + 8 radial sections (each with icon and text label) + dark gray background + white borders and connecting lines. Both slides maintain identical layout with independently editable sections for color and icon customization.
Related Products
-

Mobile Security Service Diagram
#Company Introduction #Business Introduction #Diagram
-

Core Value-Centric Circular Strategy – The Future of Business
#Company Introduction #Business Introduction #Diagram
-

Business Area Diffusion Diagram – Connection and Cluster
#Company Introduction #Business Introduction #Diagram
-

Atomic Structure Science Diagram – Visualizing the Essence of Science
#Company Introduction #Business Introduction #Diagram
