Timeline of Food Culture and Ingredient Evolution Visualized
RB0700013-1_4
- Last Update 03/16/2025
- File Size 2.3MB
- # of Slides 2
- File Format PPTX
- Slide Ratio 4:3
- Color
Keywords
About the Product
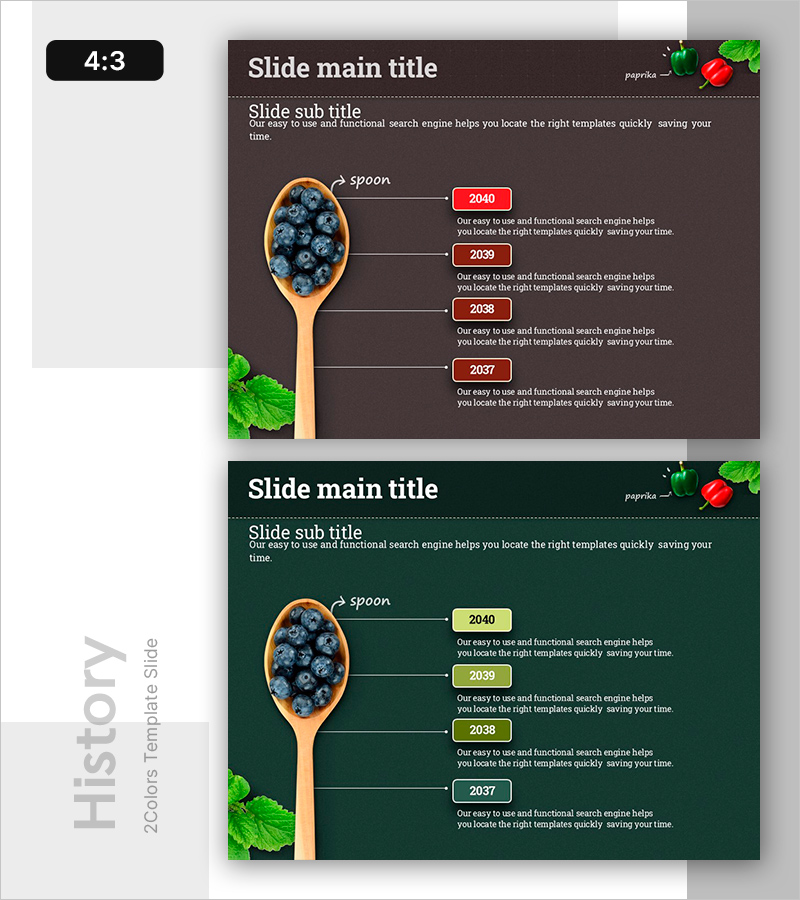
A PowerPoint slide visualizing the evolution of food culture and ingredient changes through a 4-stage timeline diagram. This presentation template features a spoon illustration with blueberry and mint imagery, creating an intuitive connected flow diagram that displays chronological progression. The design uses dark brown and dark green backgrounds with red and gold accent boxes to distinguish each stage, while arrows and text lines establish clear information flow. Formatted in 4:3 aspect ratio across 2 slides, this PPT template is ready for immediate use in food industry presentations, marketing plans, and educational materials.
Usage Points
-
Main Usage
Optimized for explaining the step-by-step transformation of food culture and culinary traditions over time. The timeline structure clearly conveys past-to-present evolution, with dedicated text areas at each stage enabling detailed information delivery and historical context.
-
How to Use
Deploy this slide in the opening sections of presentations when introducing background and historical context of food culture. Ideal for marketing plans showcasing product or brand evolution, and educational materials covering culinary history. Easily customize the year labels and descriptive text in each stage box to adapt the diagram for various transformation narratives.
-
Recommended For
Recommended for food and beverage companies, restaurants, and agricultural businesses presenting company overviews, product introductions, and marketing strategies. Suitable for university lectures, museum exhibits on food culture, and food industry seminars or conferences. Applicable to any presentation requiring visual explanation of historical progression and cultural evolution.
-
Slide Structure
Structured as a 4-stage timeline with spoon and ingredient illustrations on the left side, and year-labeled accent boxes (2040, 2039, 2038, 2037) connected by arrows to descriptive text on the right. Dark brown and green backgrounds with red and gold accent boxes create visual hierarchy across 2 slides in 4:3 aspect ratio.
Related Products
-

Business History Connection Diagram
#Company Introduction #Diagram #History
-

Spade Shape Theme History Diagram – Emphasizing Company Development
#Company Introduction #Diagram #History
-

Business Connection Diagram – Cluster and History
#Company Introduction #Diagram #Company Overview
-

Business History Connection Diagram – Company Growth Story
#Company Introduction #Diagram #History
