Syringe History Infographic - Product Development and Innovation
RB0400013_4
- Last Update 03/12/2025
- File Size 0.3MB
- # of Slides 2
- File Format PPTX
- Slide Ratio 4:3
- Color
Keywords
- #Content-Based Slides
- #Design-Based Slides
- #Company Introduction
- #Product/Service Introduction
- #Diagram
- #History
- #Development Plan
- #Cluster
- #Chain Diagram
- #4:3
- #syringe timeline infographic PowerPoint
- #product development timeline slide
- #3-stage history diagram
- #innovation timeline PPT
- #how to create timeline infographic in PowerPoint
About the Product
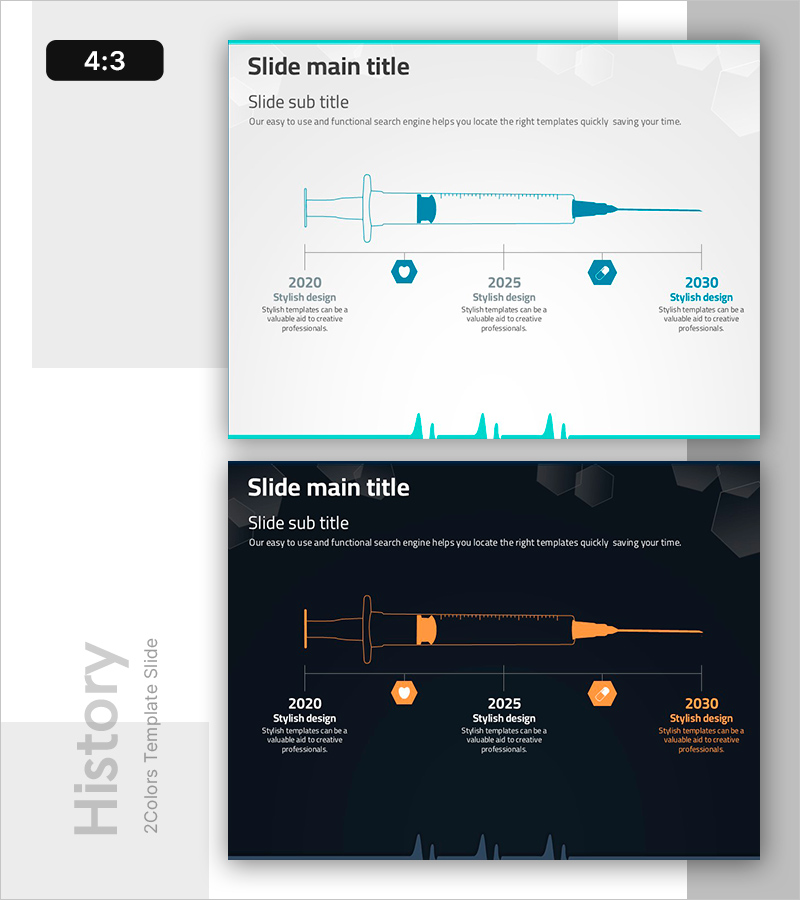
A syringe-shaped timeline infographic PowerPoint slide that visualizes product development and innovation history across three key milestones. This 2-slide deck features two color versions: a light tone with cyan accents and a dark tone with orange accents. The linear diagram displays a syringe form with three year markers (2020, 2025, 2030) and hexagonal icons positioned below to highlight major achievements at each stage. A wave graph element at the bottom emphasizes growth trends over time. The slides are ready to use in company overview presentations, product introduction decks, innovation announcements, and technology development reports.
Usage Points
-
Main Usage
Communicate product and technology development history in chronological order with visual clarity. The syringe-shaped linear diagram and three year markers emphasize key milestones and achievements at each stage, while the wave graph reinforces growth trajectory and innovation momentum.
-
How to Use
Insert into company history sections of corporate overview presentations, development process pages in product introduction decks, technology innovation announcements, and growth story segments of investor pitch decks. Add specific achievements, technology breakthroughs, or product launch dates under each year marker to enhance audience comprehension.
-
Recommended For
Pharmaceutical and medical device companies presenting product development history, technology firms showcasing innovation roadmaps, startups telling growth stories, and research institutions reporting project progress. Ideal for executive presentations, investor pitches, and client-facing communications requiring credibility and professional expertise.
-
Slide Structure
2-slide template with light tone (cyan accent) and dark tone (orange accent) versions. Each slide features a syringe-shaped linear diagram (3 nodes) centered on the slide, with three year markers below (hexagonal icons) and corresponding text areas for descriptions. A wave graph at the bottom visualizes growth trends and time progression.
Related Products
-

Speech Bubble History Diagram – A Fresh Take on Company Introduction
#Company Introduction #Product/Service Introduction #Diagram
-

Introduction to the History of the Architectural Company – A Visual Timeline
#Company Introduction #Diagram #Company Overview
-

History Flag Shape Diagram - Company Growth and Vision
#Company Introduction #Diagram #History
-

Company History Mini Diagram – Clear and Concise Timeline
#Company Introduction #Diagram #History
