Diagram Slide Visualizing Orange & Green Future Goals
RB0800012_4
- Last Update 03/20/2025
- File Size 3.8MB
- # of Slides 2
- File Format PPTX
- Slide Ratio 4:3
- Color
Keywords
- #Content-Based Slides
- #Design-Based Slides
- #Company Introduction
- #Business Vision and Strategy
- #Diagram
- #History
- #Business Goals
- #Cluster
- #Chain Diagram
- #4:3
- #timeline diagram PowerPoint
- #3-stage goal visualization slide
- #circular node diagram template
- #business vision presentation
- #roadmap PPT slide
- #future goals PowerPoint template
About the Product
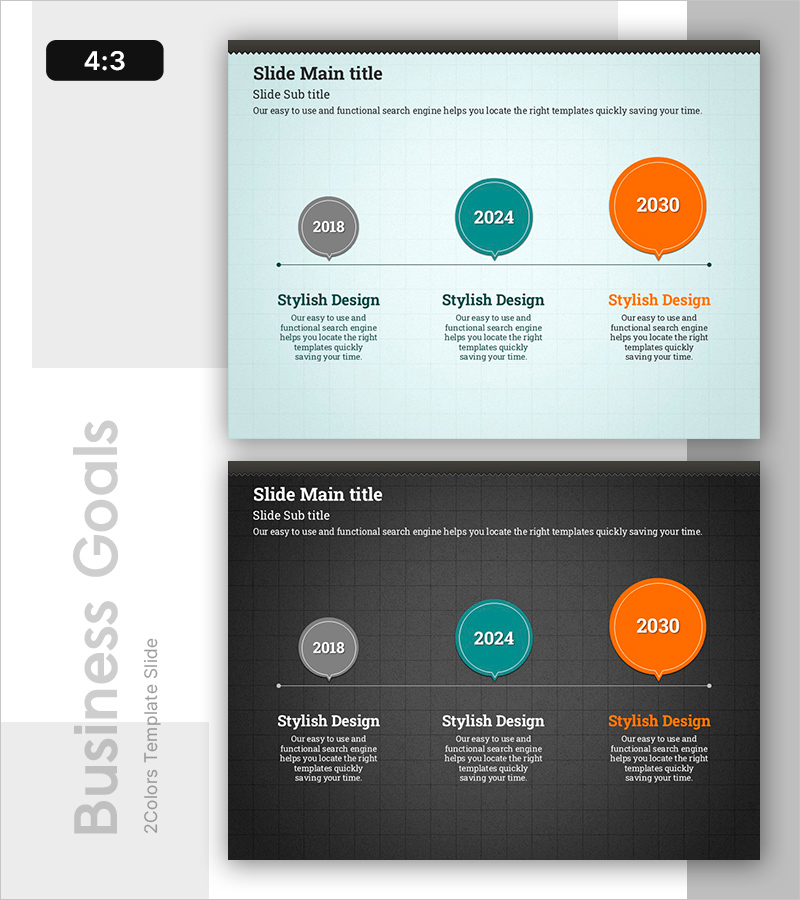
A 3-stage timeline diagram PowerPoint slide that visualizes future goals and business vision along a chronological flow. Three circular nodes in orange, green, and gray are connected by a horizontal line to intuitively represent milestone progression and goal achievement pathways. Each node includes a text area below for entering years, milestones, and strategic content. Two design versions are provided: a light mint background for optimistic presentation and a dark charcoal background for professional credibility. This PowerPoint slide is ready to use immediately for business vision presentations, mid-to-long-term strategy planning, roadmap sharing, and corporate goal communication.
Usage Points
-
Main Usage
Optimized for expressing corporate mid-to-long-term vision and future goals as a staged timeline diagram. Clearly visualizes year-by-year milestones, strategic phases, and business goal achievement pathways through circular nodes and connecting lines, enhancing audience comprehension.
-
How to Use
Enter the year or stage name in each circular node and describe the corresponding goals, strategies, and achievements in the text area below. The light background emphasizes a positive, forward-looking atmosphere, while the dark background conveys professionalism and trustworthiness. Freely edit colors and text to customize the slide to match your corporate brand identity.
-
Recommended For
Ideal for executive reports, business plan presentations, investor pitch decks (IR), strategy planning meetings, organizational vision sharing, product roadmap explanations, and mid-to-long-term growth strategy presentations. Frequently used by consulting firms, startups, corporate strategy teams, and marketing departments.
-
Slide Structure
2-slide set. Each slide features 3 circular nodes of varying sizes arranged horizontally with a connecting line, and text input areas positioned below each node. Node colors are differentiated as gray (2018), teal (2024), and orange (2030). Format: 4:3 aspect ratio PPTX.
Related Products
-

Timeline of Core Technology Development – Vision and Strategy
#Company Introduction #Business Vision and Strategy #Diagram
-

Traditional PPT Future Goals and Schedule Plan – Vision-Embedded Cluster
#Company Introduction #Business Vision and Strategy #Diagram
-

List of Studies by Year Slide – Business Strategy and Vision
#Company Introduction #Business Vision and Strategy #Diagram
-

Timeline Diagram for Business Goals and Schedule – Journey to Achieve Vision
#Company Introduction #Business Vision and Strategy #Diagram
