Global Market Analysis Map – Importance of Market Connectivity
RJ0300055_10
- Last Update 05/02/2025
- File Size 4MB
- # of Slides 2
- File Format PPTX
- Slide Ratio 16:9
- Color
Keywords
- #Content-Based Slides
- #Design-Based Slides
- #Company Introduction
- #Market and Competitor Analysis
- #Graph
- #Other
- #Global Network
- #Market Analysis
- #Column
- #Column Chart
- #Map
- #16:9
- #world map PowerPoint slide
- #global map presentation template
- #regional data visualization
- #world map bar chart
- #international business slides
About the Product
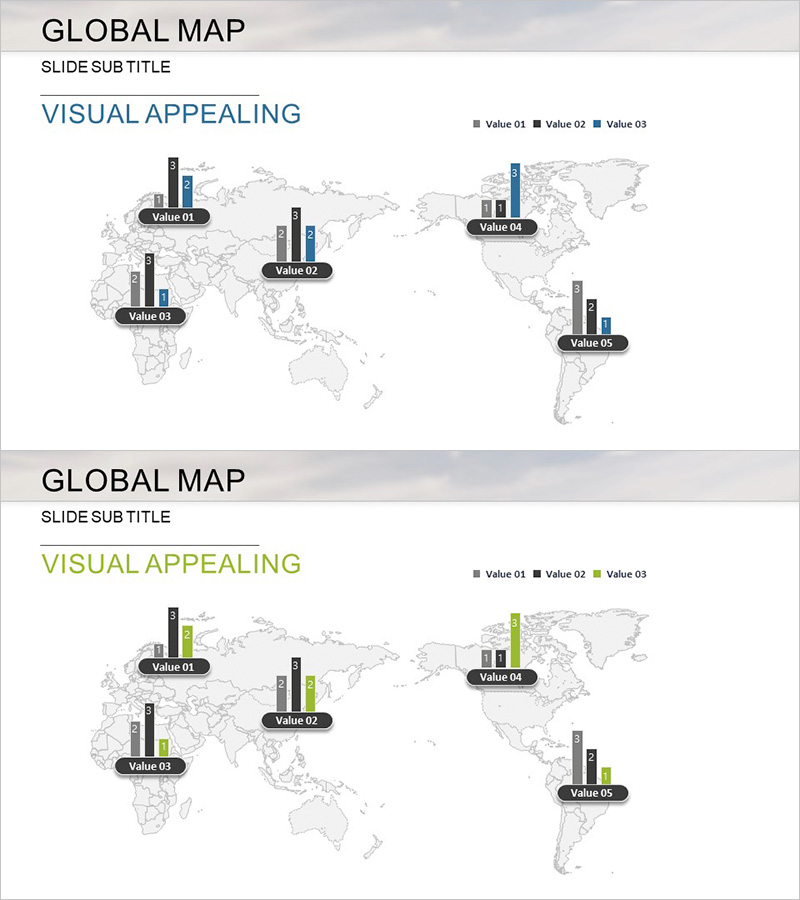
A professional world map-based PowerPoint slide designed for global market analysis and regional business performance comparison. The template features a light gray world map background with bar charts positioned at five key regions (Asia, Europe, Americas, Africa, and Oceania), displaying three data series per region in black, gray, and blue color schemes. Ideal for international business presentations, market analysis reports, and global strategy documentation. Two slide variations are included with color options (blue and green accent bars) to match your presentation theme. Delivered in 16:9 widescreen PPTX format for immediate editing and customization.
Usage Points
-
Main Usage
Visualize global market conditions, regional sales performance, international business results, and multinational company regional analysis by combining geographic context with numerical data. The world map layout enables audiences to understand both location-based insights and comparative metrics simultaneously.
-
How to Use
Replace bar chart values with your actual regional data and update the legend labels (Value 01, 02, 03) to match your metrics. Select the color variation (blue or green) that best fits your presentation theme, or customize by adding additional regions or modifying the chart structure.
-
Recommended For
Global marketing strategy presentations, international sales performance reports, multinational regional performance analysis, overseas expansion planning, international consulting projects, and global supply chain analysis where regional comparison is essential.
-
Slide Structure
Slide 1: Black, gray, and blue bar combination / Slide 2: Black, gray, and green bar combination. Each slide displays a world map background with three-series bar charts positioned at five regions (Asia, Europe, Americas, Africa, Oceania), including title and legend at the top and Value 01–05 labels at each region.
Related Products
-

Target Country Analysis Bar Graph – Insights into Global Markets
#Company Introduction #Market and Competitor Analysis #Graph
-

Global Country Analysis Vertical Bar Graph – Market and Competitor Analysis
#Company Introduction #Market and Competitor Analysis #Graph
-

Target Country Analysis Graph – Understanding Global Markets
#Company Introduction #Graph #Other
-

Idea Presentation Template Wide Map – Global Market Analysis
#Company Introduction #Market and Competitor Analysis #Other
