Global Comparison of National Sustainability Contributions
RB0500010_9
- Last Update 03/13/2025
- File Size 3.2MB
- # of Slides 2
- File Format PPTX
- Slide Ratio 4:3
- Color
Keywords
- #Content-Based Slides
- #Design-Based Slides
- #Company Introduction
- #Market and Competitor Analysis
- #Graph
- #Other
- #Global Network
- #Market Analysis
- #Map
- #4:3
- #world map PowerPoint slide
- #regional comparison presentation
- #global market analysis slide
- #geographic data visualization PPT
- #how to create a world map slide in PowerPoint
About the Product
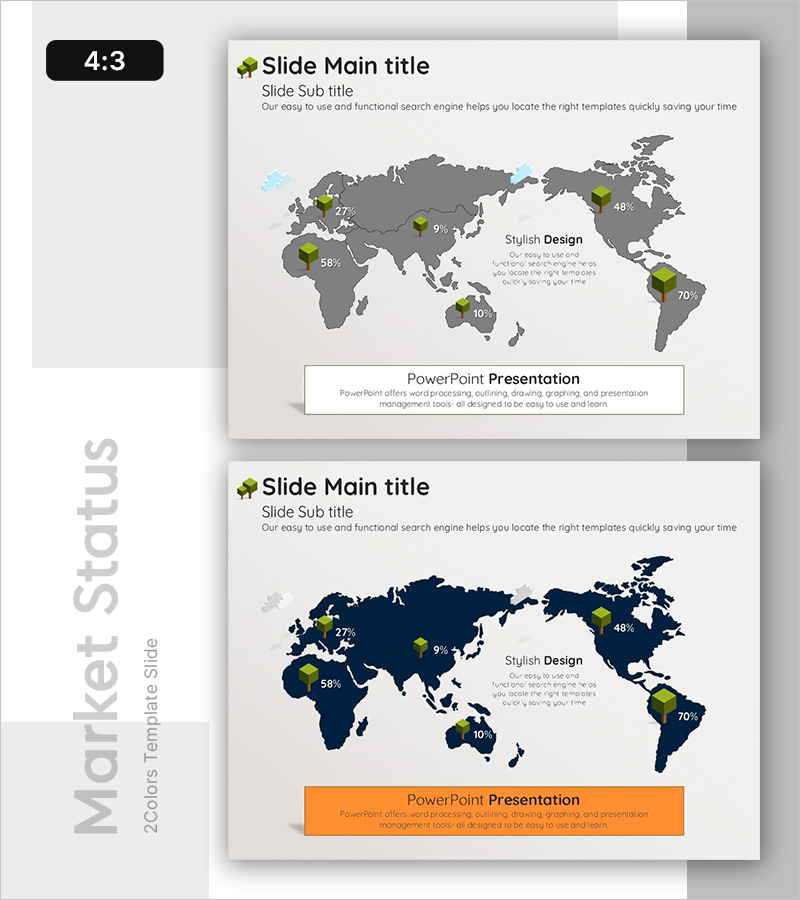
A geography-based PowerPoint slide set for presenting global market data and regional performance comparisons. The slides feature a world map in gray or navy tones with green 3D cube icons representing numerical data across key regions. Title, subtitle, and descriptive text areas are positioned at the top for clear messaging. Two color variations allow you to match your presentation's visual tone. These PowerPoint slides are optimized for visualizing market share, regional contributions, global expansion metrics, and comparative analysis. Fully editable PPTX format enables quick customization of data, text, and styling.
Usage Points
-
Main Usage
Visualize global market distribution, regional performance metrics, and country-level data on an interactive world map. The slide layout allows stakeholders to quickly understand geographic variations in market share, revenue, or strategic presence. Perfect for investor pitches, board presentations, and strategic planning sessions where geographic context is critical.
-
How to Use
Edit the title, subtitle, and description text at the top to match your presentation topic. Replace the numerical data on each region with your actual statistics. Choose between the gray background version for neutral, professional tone or the navy version for trust and stability emphasis. All elements—colors, numbers, text—are fully customizable in PowerPoint.
-
Recommended For
Executives and marketing teams presenting global expansion strategies, international business development reports, and market penetration analysis. Ideal for investor relations presentations, consulting firms showcasing market research, multinational corporations reporting regional performance, and export-import companies highlighting geographic market presence.
-
Slide Structure
Each slide contains a header section with title, subtitle, and explanatory text, followed by a world map occupying the lower two-thirds. Six to eight regions are marked with green 3D cube icons and corresponding percentage or numerical values. A 'Stylish Design' text box on the right provides additional context. Both slides maintain identical layout with only color variation, ensuring visual consistency throughout your presentation.
Related Products
-

Global Market Analysis Chart – Market Trends and Data Visualization
#Company Introduction #Market and Competitor Analysis #Graph
-

Global Country Analysis Vertical Bar Graph – Market and Competitor Analysis
#Company Introduction #Market and Competitor Analysis #Graph
-

Global Market Analysis Map – Importance of Market Connectivity
#Company Introduction #Market and Competitor Analysis #Graph
-

Global Area Analysis Bar Graph – Visualization of Market and Competition
#Company Introduction #Market and Competitor Analysis #Graph
