Global Country Analysis Vertical Bar Graph – Market and Competitor Analysis
RJ0300071_6
- Last Update 05/08/2025
- File Size 0.7MB
- # of Slides 2
- File Format PPTX
- Slide Ratio 16:9
- Color
Keywords
- #Content-Based Slides
- #Design-Based Slides
- #Company Introduction
- #Market and Competitor Analysis
- #Graph
- #Other
- #Global Network
- #Market Analysis
- #Column
- #Column Chart
- #Map
- #16:9
- #world map PowerPoint slide
- #regional comparison chart
- #global market analysis presentation
- #country bar graph
- #competitor analysis slide
- #map-based data visualization
About the Product
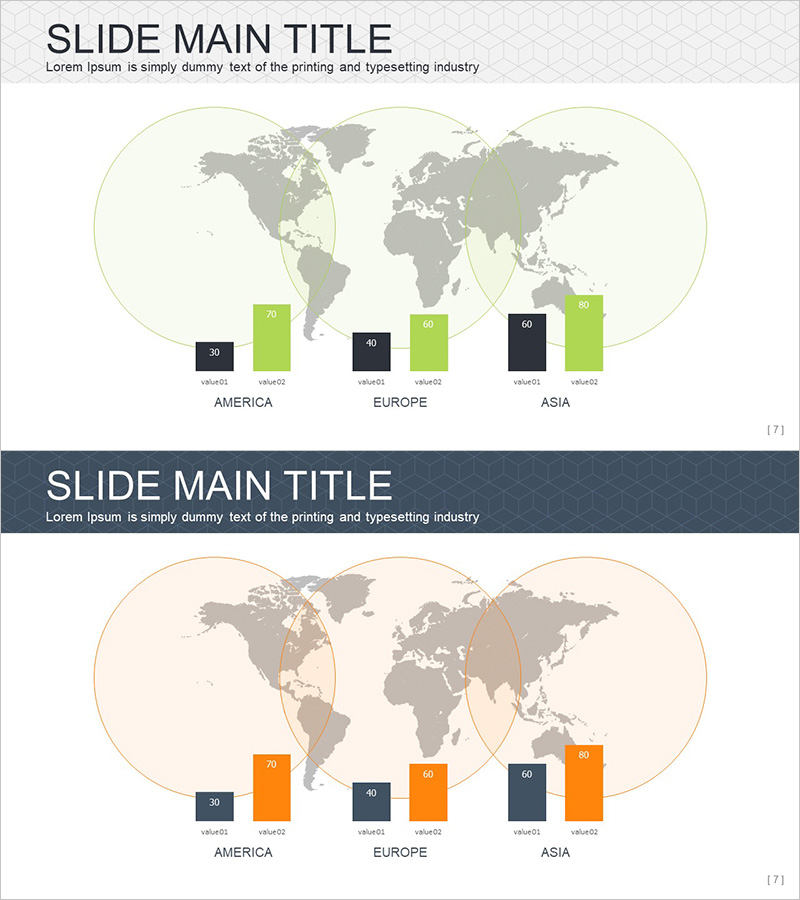
A world map-based vertical bar chart PowerPoint slide designed for global market analysis and country-by-country competitor comparison. This presentation template overlays three regions—America, Europe, and Asia—with circular highlights and visualizes six data items per region (value01~value02) using a two-tone color scheme of dark navy and lime green bars. Two background color variations (beige and white) are included for flexible design adaptation. Delivered in 16:9 widescreen PPTX format with fully editable elements. Ideal for international business presentations, market entry strategies, and competitive analysis reports.
Usage Points
-
Main Usage
Visualize global market size, regional sales volumes, country-level competitor positions, and international business performance comparisons by combining geographic mapping with quantitative bar data. Communicates clear regional differences to executives and investors through intuitive spatial and numerical representation.
-
How to Use
Place three regions on the world map with circular emphasis overlays, then position corresponding vertical bar charts below each region to enable direct regional comparison. The navy-and-lime-green two-tone palette creates high contrast for data readability. Choose between beige or white backgrounds to match your presentation's overall tone and corporate branding.
-
Recommended For
International marketing teams presenting market entry strategies, global sales organizations reporting regional performance metrics, executive-level international business analysis, investor presentations on global expansion plans, and consulting firms showcasing country-level market research findings.
-
Slide Structure
Two-slide layout: Slide 1 features beige background with world map, three circular regional highlights, and six vertical bars per region (navy and lime green). Slide 2 provides identical structure with white background variation. 16:9 widescreen format in PPTX with all elements fully editable and customizable.
Related Products
-

Global Market Analysis Map – Importance of Market Connectivity
#Company Introduction #Market and Competitor Analysis #Graph
-

Target Country Analysis Bar Graph – Insights into Global Markets
#Company Introduction #Market and Competitor Analysis #Graph
-

Pixel Graphical Maps and Tables - Visualizing Global Network
#Company Introduction #Market and Competitor Analysis #Diagram
-

Global Area Analysis Bar Graph – Visualization of Market and Competition
#Company Introduction #Market and Competitor Analysis #Graph
