Annual Crime Rate by Country Visualization PowerPoint Template
RJ0800010_11
- Last Update 08/02/2025
- File Size 0.7MB
- # of Slides 2
- File Format PPTX
- Slide Ratio 16:9
- Color
Keywords
- #Content-Based Slides
- #Design-Based Slides
- #Company Introduction
- #Market and Competitor Analysis
- #Other
- #Global Network
- #Market Analysis
- #Map
- #16:9
- #crime rate by country PowerPoint slide
- #world map visualization slide
- #global analysis PPT
- #country comparison chart slide
- #how to visualize crime statistics in PowerPoint
About the Product
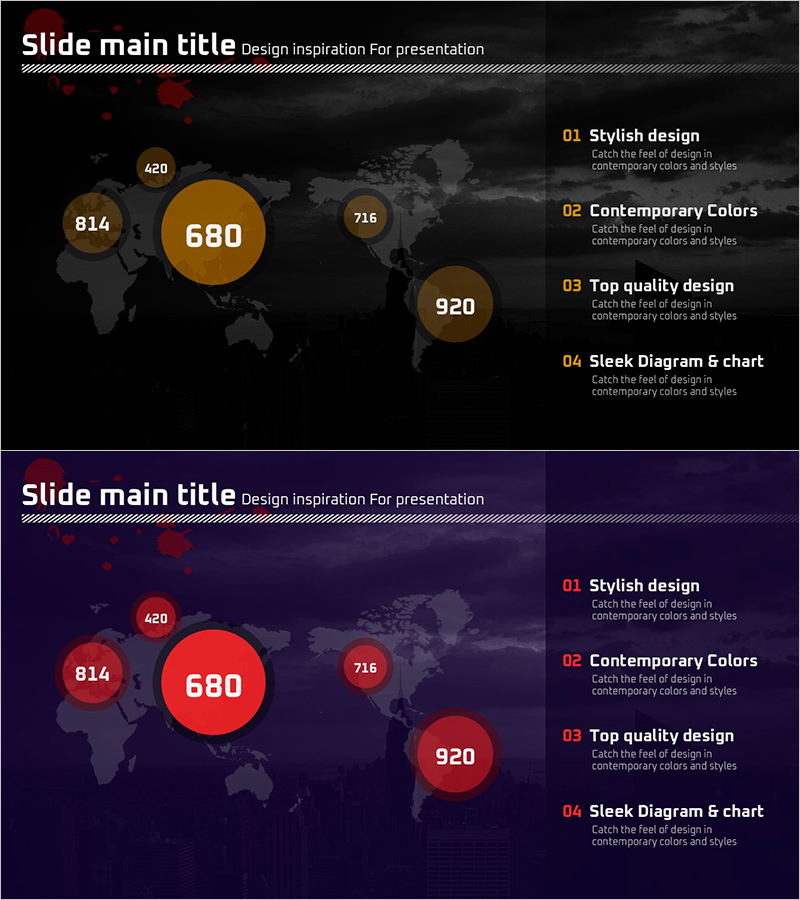
A PowerPoint slide visualizing crime rates by country on a world map using circular charts. The design features a dark background with gold-toned circular data visualizations positioned over geographic regions, complemented by four descriptive text sections on the right side. This 2-slide presentation is ready for immediate use in global network analysis, market research, and international comparison presentations. The layout effectively communicates numerical insights through intuitive visual hierarchy. Provided in 16:9 widescreen PPTX format.
Usage Points
-
Main Usage
Communicate global market analysis, country-by-country statistical comparisons, and international business insights through data-driven visualization. The world map with circular charts enables stakeholders to quickly grasp crime rate figures across nations and supports evidence-based decision-making in international contexts.
-
How to Use
Deploy in investor presentations, international partnership meetings, market research reports, and global risk analysis decks. Edit the four text sections on the right to highlight key analytical points, and customize the circular chart values to reflect your actual data. The slide structure accommodates both comparative and trend-based narratives.
-
Recommended For
International business professionals, market research analysts, policy makers, academic researchers, and global network managers presenting country-level comparative data. Ideal for visualizing crime statistics, economic indicators, social metrics, and other nation-specific numerical datasets.
-
Slide Structure
Two-slide composition with each slide featuring a world map background on the left, four circular data charts (center 680, upper-left 814 and 420, lower-right 716 and 920), and four text blocks on the right with title and description areas. Dark background with gold accent colors ensures data readability and visual emphasis.
Related Products
-

Idea Presentation Template Wide Map – Global Market Analysis
#Company Introduction #Market and Competitor Analysis #Other
-

Pixel Graphical Maps and Tables - Visualizing Global Network
#Company Introduction #Market and Competitor Analysis #Diagram
-

Global Network Market Trends – Insights through Data Visualization
#Company Introduction #Market and Competitor Analysis #Graph
-

Global Market Snapshot – Market Analysis and Outlook
#Company Introduction #Market and Competitor Analysis #Diagram
