Competitor Analysis Comparison Graph – Visualizing Market Shares
RJ0300077_7
- Last Update 05/10/2025
- File Size 1MB
- # of Slides 2
- File Format PPTX
- Slide Ratio 16:9
- Color
Keywords
- #Content-Based Slides
- #Design-Based Slides
- #Market and Competitor Analysis
- #Graph
- #Competitor Analysis
- #Competitive Advantage
- #Line
- #Line Chart
- #16:9
- #line chart PowerPoint slide
- #trend comparison presentation
- #competitor analysis chart
- #market share graph
- #dual-series data visualization
- #how to create line chart in PowerPoint
About the Product
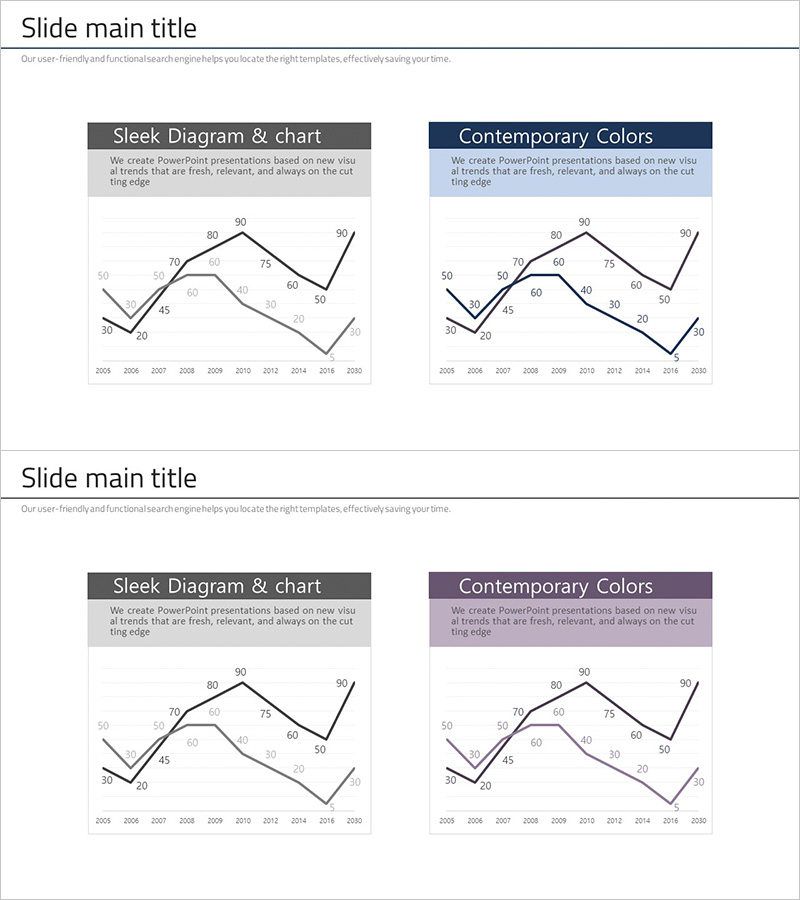
A line chart PowerPoint slide designed for competitor analysis and market share comparison. This template visualizes two data series over time, clearly showing trend changes from 2005 to 2030. The slide deck includes two distinct color themes—gray and navy—each with a dedicated graph area and title section. With approximately 8 data points per series, it effectively displays long-term trend analysis. The PPTX format allows immediate editing and customization for your presentation needs.
Usage Points
-
Main Usage
This slide effectively compares two data series over time, such as competitor market share changes, sales trend comparisons, or performance metric fluctuations. The dual-line visualization allows viewers to instantly grasp the relationship between two trends, making it ideal for strategic planning and executive decision-making presentations.
-
How to Use
Slide 1 features a gray theme while Slide 2 uses a navy theme. Double-click the chart area to edit data values, and the line chart will automatically update. Modify the title and legend text to match your analysis content. All elements are fully editable within PowerPoint.
-
Recommended For
Marketing managers, sales directors, business analysts, consultants, and executives preparing competitive analysis reports, market research presentations, and performance reviews. Ideal for quarterly and annual performance comparison presentations across departments.
-
Slide Structure
Each slide contains a title section at the top (Sleek Diagram & chart / Contemporary Colors) and a graph area below. The line chart includes an X-axis (2005–2030), Y-axis (0–90 range), two trend lines with approximately 8 data points each, and a legend with data labels for clear interpretation.
Related Products
-

Variation Graph for the Line Chart – Optimized Design for Market and Competitor Analysis
#Market and Competitor Analysis #Graph #Competitor Analysis
-

Competition Graphs and Analysis – Slides for Market Advantage
#Market and Competitor Analysis #Graph #Competitor Analysis
-

Visualizing Menu Sales Status with Line Chart
#Market and Competitor Analysis #Graph #Competitor Analysis
-

Modern Theme Competitor Analysis Graph
#Market and Competitor Analysis #Graph #Competitor Analysis
