Online Presentation Template - Pie Chart & Radar Chart
RJ0200025_11
- Last Update 04/04/2025
- File Size 3.2MB
- # of Slides 2
- File Format PPTX
- Slide Ratio 16:9
- Color
Keywords
- #Content-Based Slides
- #Design-Based Slides
- #Product/Service Introduction
- #Market and Competitor Analysis
- #Graph
- #Development Status
- #Market Analysis
- #Circles
- #Other
- #Pie Chart
- #Radar Chart Spider Chart
- #16:9
- #pie chart PowerPoint slide
- #radar chart presentation template
- #data comparison slides
- #market analysis template
- #competitive analysis PowerPoint
- #how to create pie and radar charts in PowerPoint
About the Product
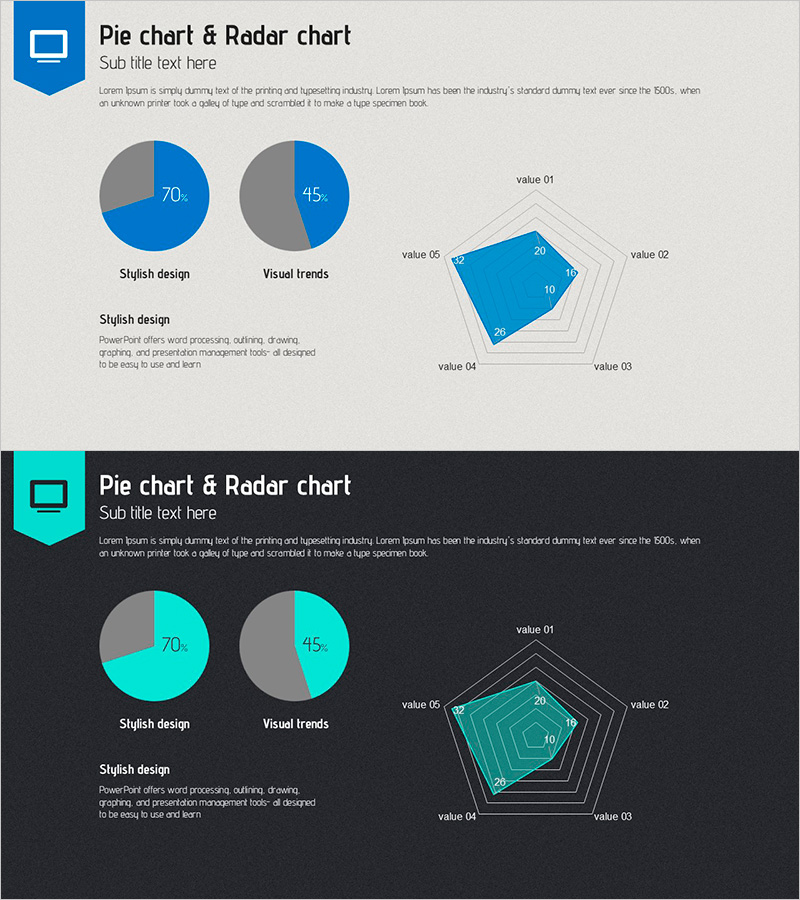
A 2-slide PowerPoint presentation featuring pie charts and radar charts for comprehensive data visualization. The first slide displays two blue pie charts (70% and 45% segments) on a light gray background with a 5-axis radar chart positioned on the right. The second slide presents the same layout with cyan pie charts and radar chart on a dark background. Available in 16:9 widescreen PPTX format with fully editable elements, ideal for market analysis, competitive benchmarking, performance comparison, and multi-dimensional data presentation in business reports and strategic presentations.
Usage Points
-
Main Usage
Visualize proportional data with pie charts while simultaneously comparing multiple metrics across categories using radar charts. Effectively communicate market share, competitive strengths, product performance ratings, organizational capability assessments, and multi-factor evaluations in a single integrated visual.
-
How to Use
Use the light background slide for daytime meetings and formal presentations; apply the dark background slide for evening events and premium-tier presentations. Replace pie chart percentages and radar axis labels with your actual data values. Both slides maintain consistent visual hierarchy and are ready for immediate deployment.
-
Recommended For
Marketing professionals presenting market analysis reports, executives delivering competitive intelligence briefings, product development teams comparing performance metrics, management consultants presenting diagnostic findings, sales teams analyzing customer segments, and strategic planners evaluating multi-dimensional organizational data.
-
Slide Structure
Slide 1 (light gray background): Two blue pie charts with percentage labels (70%, 45%) positioned left-center + 5-axis radar chart with value 01-05 labels on right / Slide 2 (dark background): Identical layout with cyan pie charts and radar chart. Both slides include title area and descriptive text space on the left margin.
Related Products
-

Market Share Analysis Area & Pie Chart – The Power of Data Visualization
#Product/Service Introduction #Market and Competitor Analysis #Graph
-

Market Analysis Pie Chart – Vibrant Visualization in Contemporary Colors
#Product/Service Introduction #Market and Competitor Analysis #Diagram
-

Current Status Analysis Pie Chart – Insights for Market Analysis
#Product/Service Introduction #Market and Competitor Analysis #Diagram
-

Manufacturing Analysis Graph – Market and Competitive Analysis
#Product/Service Introduction #Market and Competitor Analysis #Graph
