Medical Analysis Pie Chart – Visualization of Market Trends
RJ0400033_10
- Last Update 05/26/2025
- File Size 2.9MB
- # of Slides 2
- File Format PPTX
- Slide Ratio 16:9
- Color
Keywords
- #Content-Based Slides
- #Design-Based Slides
- #Product/Service Introduction
- #Market and Competitor Analysis
- #Graph
- #Development Status
- #Market Analysis
- #Circles
- #Pie Chart
- #16:9
- #pie chart PowerPoint
- #pie graph template
- #ratio visualization slide
- #medical data analysis PPT
- #market analysis chart template
About the Product
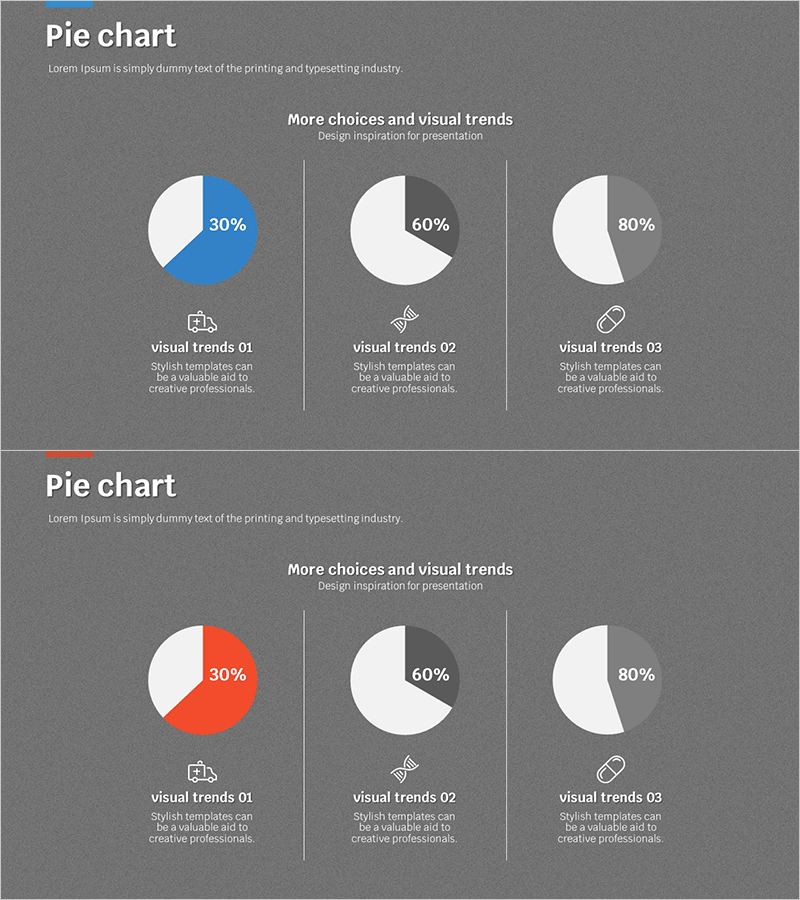
A professional pie chart PowerPoint slide designed for medical and market analysis data visualization. This 2-slide template presents multiple ratio expression methods: the first slide features a blue accent color to highlight specific data segments, while the second slide uses neutral gray tones for objective data comparison. Available in 16:9 widescreen PPTX format for immediate editing. Ideal for healthcare institutions, pharmaceutical companies, and market research firms preparing presentations and reports. Each chart clearly displays percentage values to enhance audience comprehension and data retention.
Usage Points
-
Main Usage
Effectively communicate proportion-based information such as medical statistics, market share, and customer demographics through circular chart visualization. Combines percentage values with visual proportions to enable rapid audience understanding and decision-making.
-
How to Use
Modify data values in the slide master to automatically update chart segments. Select between color-accent and neutral-tone versions based on presentation context. Freely edit titles, legends, and descriptive text to match your specific data and messaging requirements.
-
Recommended For
Healthcare institutions presenting patient statistics, pharmaceutical companies reporting market analysis, market research firms analyzing customer segmentation, financial institutions explaining portfolio composition, and educational organizations presenting enrollment and demographic data.
-
Slide Structure
Slide 1: Blue-accent pie chart (3 segments showing 30%, 60%, 80%) with 3 icons and descriptive text / Slide 2: Gray-tone pie charts (3 identical segments) with 3 icons and descriptive text. Total 2 slides, 16:9 aspect ratio, PPTX format.
Related Products
-

Market Share Analysis Area & Pie Chart – The Power of Data Visualization
#Product/Service Introduction #Market and Competitor Analysis #Graph
-

Clock Shape Circular Diagram – Product and Market Analysis
#Product/Service Introduction #Market and Competitor Analysis #Graph
-

Current Status Analysis Pie Chart – Insights for Market Analysis
#Product/Service Introduction #Market and Competitor Analysis #Diagram
-

Watch Shape Market Share Graph – Data Visualization and Analysis
#Product/Service Introduction #Market and Competitor Analysis #Diagram
