Blue Green Double Bar Graph – Market Competitive Advantage Analysis
RJ0600027_31
- Last Update 06/27/2025
- File Size 0.2MB
- # of Slides 2
- File Format PPTX
- Slide Ratio 16:9
- Color
Keywords
- #Content-Based Slides
- #Design-Based Slides
- #Market and Competitor Analysis
- #Graph
- #Competitor Analysis
- #Competitive Advantage
- #Horizontal Bar
- #Double Horizontal Bar
- #16:9
- #double bar chart PowerPoint
- #horizontal bar graph template
- #comparative analysis slide
- #competitive analysis chart
- #how to create bar chart in PowerPoint
About the Product
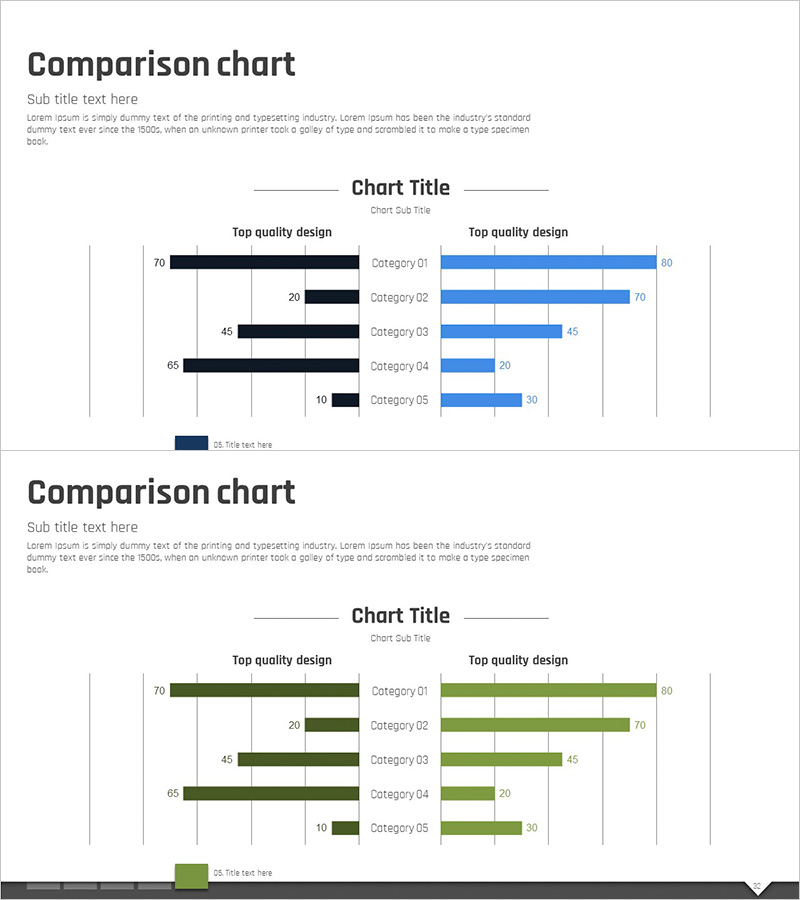
A dual-axis horizontal bar chart PowerPoint slide featuring blue and green color schemes for side-by-side data comparison. This template displays five categories with paired bars on opposite sides, ideal for competitive analysis, market share comparison, and performance benchmarking presentations. The grid background and clear axis labels enhance data readability, making it suitable for business proposals, quarterly reports, investor pitches, and strategic presentations.
Usage Points
-
Main Usage
This chart visualizes two data series side-by-side for direct comparison. It's designed for competitive positioning analysis, market share benchmarking, product feature comparison, year-over-year performance review, and any presentation requiring dual-dataset visualization.
-
How to Use
Open the slide and input your numerical values into each category; the bar lengths adjust automatically. Customize the legend, axis labels, and title to match your presentation context. Color changes are simple to implement. Ready for executive briefings, investor meetings, and strategic planning sessions.
-
Recommended For
Strategy, marketing, sales, and finance professionals presenting competitive analysis, performance metrics, and market insights. Ideal for business plans, proposals, quarterly reports, pitch decks, and investor relations materials where data-driven decision-making is critical.
-
Slide Structure
2-slide template. First slide features a blue-green dual bar chart with 5 categories (each showing a pair of horizontal bars). Second slide presents the same structure in green-olive tones. Both include title, subtitle, legend, and axis label areas for customization.
Related Products
-

Eco-Friendly Business Goal Market Strategy Horizontal Bar Chart
#Market and Competitor Analysis #Graph #Competitor Analysis
-

Bar Graph Comparing Exercise Performance by Group
#Market and Competitor Analysis #Graph #Competitor Analysis
-

Competitive Comparison Analysis Bar Graph – Visualizing Market Advantage
#Market and Competitor Analysis #Graph #Competitor Analysis
-

Benchmarking with Bar Chart Comparison
#Market and Competitor Analysis #Diagram #Graph
