Horizontal Bar Graph for Cooking Competition
RJ0800003_13
- Last Update 07/31/2025
- File Size 0.6MB
- # of Slides 2
- File Format PPTX
- Slide Ratio 16:9
- Color
Keywords
- #Content-Based Slides
- #Design-Based Slides
- #Market and Competitor Analysis
- #Graph
- #Competitor Analysis
- #Competitive Advantage
- #Horizontal Bar
- #Double Horizontal Bar
- #16:9
- #horizontal bar chart PowerPoint
- #dual-direction bar graph
- #data comparison slide template
- #PowerPoint chart design
- #5-item comparison template
About the Product
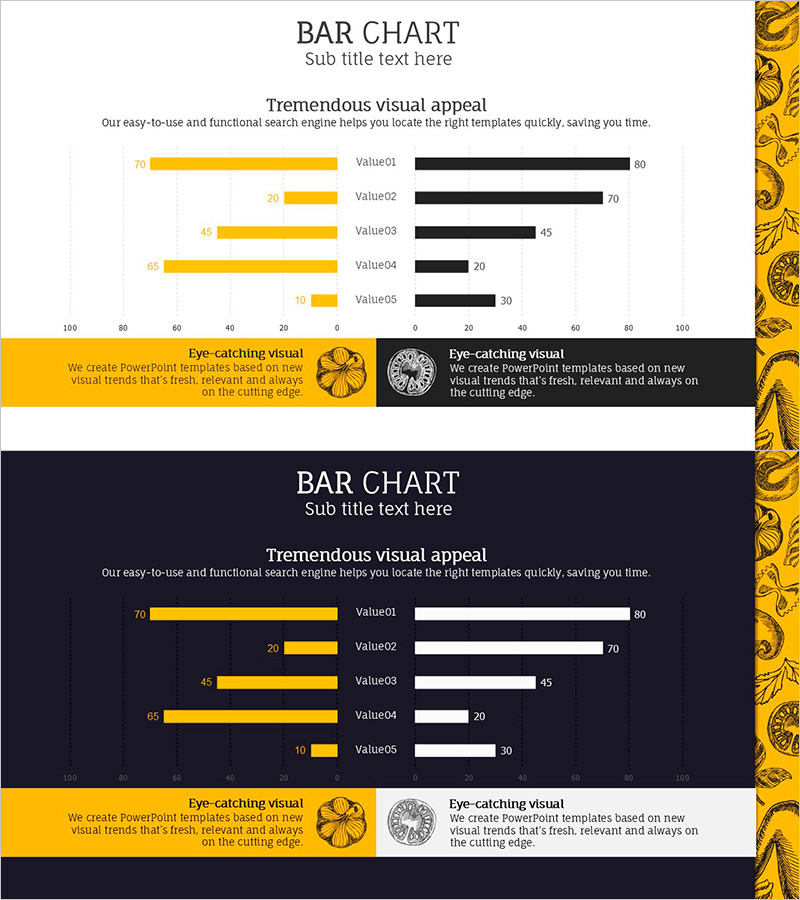
A dual-direction horizontal bar chart PowerPoint slide that compares two data series symmetrically using contrasting gold and black bars. This design effectively visualizes competitive advantage, market analysis, performance comparison, and data-driven insights across five items simultaneously. The slide deck includes two versions—light background and dark background—allowing seamless integration with any presentation theme. Ideal for business reports, marketing presentations, and analytical documents where side-by-side data comparison is essential.
Usage Points
-
Main Usage
Displays two data series in opposing horizontal bars to highlight competitive positioning, market share comparison, performance metrics, and strength-weakness analysis. The gold and black color contrast creates clear visual distinction between two groups, supporting up to five simultaneous item comparisons with numerical precision.
-
How to Use
Use in business reports, marketing strategy presentations, competitive analysis documents, and performance review meetings to compare departmental results, product lines, regional performance, or budget versus actual metrics. Simply edit the bar lengths and values to input your data; the visualization updates automatically. Choose between light or dark background versions to match your presentation color scheme.
-
Recommended For
Recommended for executives, marketing teams, sales departments, and analytics teams presenting competitive benchmarks, regional performance, product portfolio comparisons, and budget variance analysis. Ideal for consulting reports, investor presentations, quarterly business reviews, and market research findings where data-driven decision-making is central.
-
Slide Structure
Two-slide set. Each slide displays five items (Value01–Value05) in symmetric dual-direction bars: left side gold bars (0–100 scale) and right side black bars (0–100 scale). Layout includes title and subtitle area at top, central chart area with gridlines, and descriptive text section at bottom for annotations.
Related Products
-

Competitor Analysis Double Bar Graph – Visualizing Competitive Advantage
#Market and Competitor Analysis #Graph #Competitor Analysis
-

Sailing Travel Service Company and Competitor Analysis Dual Horizontal Chart
#Market and Competitor Analysis #Graph #Competitor Analysis
-

Competitor Paired Bar Graph – Market Analysis and Comparison
#Market and Competitor Analysis #Graph #Competitor Analysis
-

Competitor Analysis and Competitive Advantage – Red, Blue, Purple Bar Chart
#Market and Competitor Analysis #Graph #Competitor Analysis
