Simple Cement Theme Analysis Chart – Understanding Competitor and Market Context
RJ0300058_6
- Last Update 05/04/2025
- File Size 3MB
- # of Slides 2
- File Format PPTX
- Slide Ratio 16:9
- Color
Keywords
- #Content-Based Slides
- #Design-Based Slides
- #Market and Competitor Analysis
- #Diagram
- #Graph
- #Competitor Analysis
- #Market Analysis
- #Table
- #Horizontal Bar
- #Standard Table
- #Segmented Horizontal Bar
- #16:9
- #horizontal bar chart PowerPoint
- #bar graph slide template
- #market analysis chart
- #competitor comparison
- #data visualization PowerPoint slide
About the Product
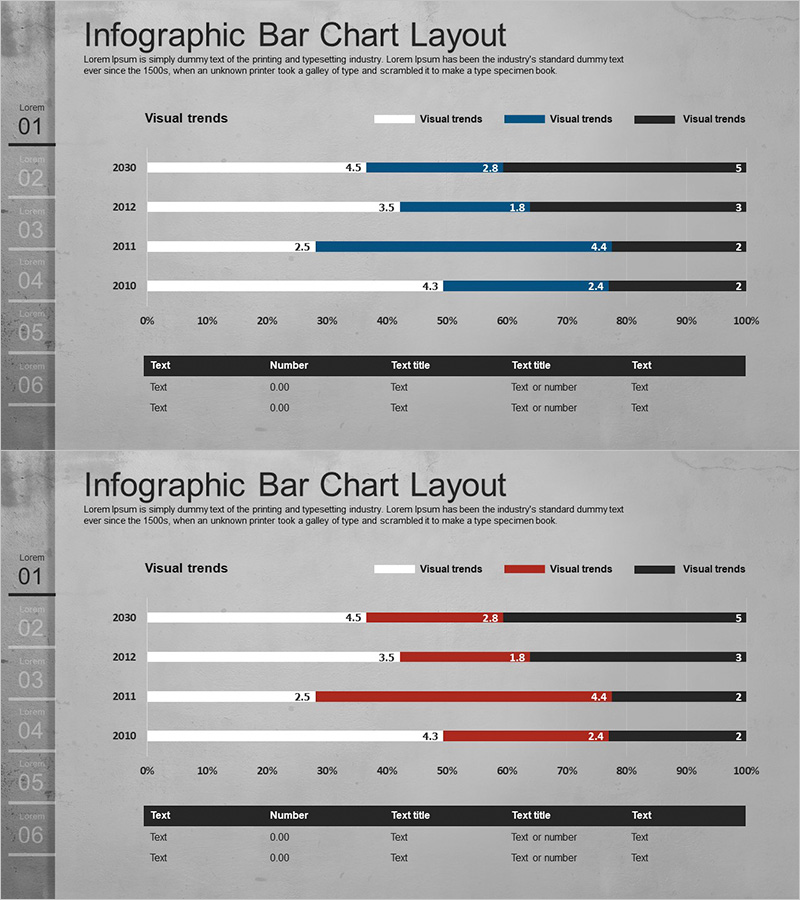
A horizontal bar chart PowerPoint slide optimized for market analysis and competitor comparison. Featuring a cement-gray background with blue, red, and black data series, this slide presents year-over-year trends and multi-item comparisons in an intuitive visual format. Clear legend and data labels are positioned for easy interpretation, with an editable table section below for supplementary information. Ready to use in business reports, marketing plans, pitch decks, and investment presentations requiring quantitative analysis.
Usage Points
-
Main Usage
Compares numerical values across years or categories, ideal for market share analysis, competitor performance benchmarking, and trend visualization. The 4-series format enables simultaneous multi-data comparison, while legend and value labels enhance information clarity and audience comprehension.
-
How to Use
Deploy in business reports' market overview section, marketing plans' competitive analysis pages, and investor presentations' performance comparison charts. Bar length and color coding emphasize priority and variance, while the data table below provides precise figures to strengthen credibility and support strategic conclusions.
-
Recommended For
Executives, marketing teams, sales professionals, analysts, and consultants presenting data-driven strategies. Particularly effective for visualizing market size, sales volume, customer satisfaction scores, cost comparisons, and multi-dimensional performance metrics.
-
Slide Structure
2-slide set. First slide displays 4-year horizontal bar chart (2030, 2012, 2011, 2010) with 3 data series across 0–100% range. Second slide uses identical structure with alternate color palette (red series). Both slides include editable table section at bottom with text, number, and title input fields.
Related Products
-

Market Analysis and Financial Performance Visualization with Horizontal Bar Chart and Table
#Market and Competitor Analysis #Financial Plans and Performance #Diagram
-

Space Industry Market Analysis Bar Graph – Providing Strategic Insights
#Market and Competitor Analysis #Graph #Competitor Analysis
-

Gradient Theme Area Diagram – Market and Competitor Analysis
#Market and Competitor Analysis #Diagram #Graph
-

Market Analysis Graph Ahead of the Future – Innovative Business Insights
#Market and Competitor Analysis #Diagram #Graph
