Innovative AI Themed Hexagonal Graph – Visualizing Market Share at Angles
RJ0700025_10
- Last Update 07/29/2025
- File Size 1.3MB
- # of Slides 2
- File Format PPTX
- Slide Ratio 16:9
- Color
Keywords
- #Content-Based Slides
- #Design-Based Slides
- #Product/Service Introduction
- #Market and Competitor Analysis
- #Graph
- #Other
- #Development Status
- #Market Share
- #16:9
- #market share hexagonal graph PowerPoint
- #competitive analysis chart slide
- #how to visualize market share in PowerPoint
- #market positioning diagram
- #dual-color comparison slide
About the Product
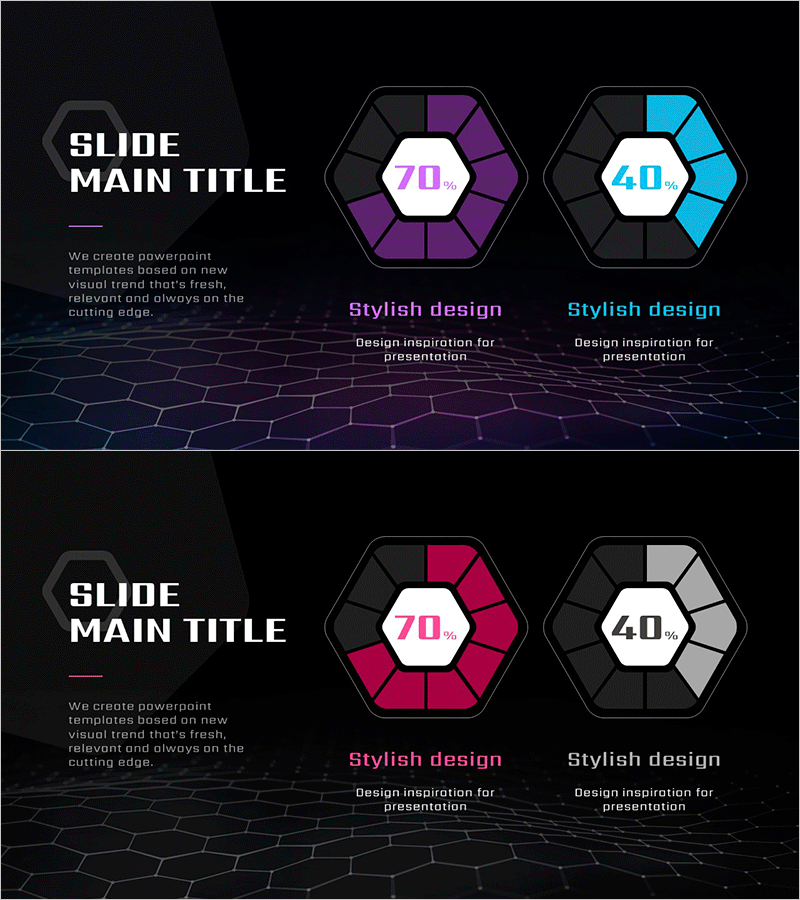
Visualize market share analysis with an AI-themed hexagonal graph comparing two competitive positions across angles. This PowerPoint slide features a dark background with purple and cyan color variants, each displaying an 8-segment hexagon for intuitive market positioning. The 2-slide set provides identical layouts with different color schemes, allowing flexible selection for various presentation contexts. Clear data entry zones enable immediate customization with market percentages and competitor labels. Optimized for technology-driven companies presenting market analysis, competitive landscape, and strategic positioning in investor pitches and quarterly reviews.
Usage Points
-
Main Usage
Communicate market share data and competitive positioning through an 8-segment hexagonal chart that clearly displays your company's market position relative to competitors. The dual-color options (purple and cyan) enable visual distinction between different market scenarios or time periods, supporting data-driven strategic discussions.
-
How to Use
Enter market share percentages in the central hexagon area and add competitor or product names in the segment labels. The dark, tech-forward design suits IT, fintech, and SaaS company presentations. Use the 2-slide set to show before-and-after market positions or compare two distinct competitive scenarios with contrasting color schemes.
-
Recommended For
Marketing managers presenting market analysis and competitive intelligence, startup founders pitching market opportunity in investor meetings, executives reporting quarterly market share performance, product managers justifying strategic positioning decisions, business development teams analyzing market landscape and growth opportunities.
-
Slide Structure
Two-column layout with title and description on the left, hexagonal chart on the right. The hexagon contains 8 segments for representing up to 8 competitive factors, with a central percentage display area and segment labels below. Both slides maintain identical structure with color variation, enabling direct visual comparison of market scenarios.
Related Products
-

Water Drop Shape Graph – Visualizing Market Share
#Product/Service Introduction #Market and Competitor Analysis #Diagram
-

Space Exploration Donut Pie Chart
#Product/Service Introduction #Market and Competitor Analysis #Graph
-

Charge Shape Circle Graph for Visualizing Data Analysis – Effective Market and Competitor Analysis
#Product/Service Introduction #Market and Competitor Analysis #Graph
-

Aerospace Industry Progress Status Graph – Analysis and Vision Presentation
#Product/Service Introduction #Market and Competitor Analysis #Graph
