Business Cycle Diagram – Effective Operational Strategy
RJ0300059_14
- Last Update 05/04/2025
- File Size 4MB
- # of Slides 2
- File Format PPTX
- Slide Ratio 16:9
- Color
Keywords
- #Content-Based Slides
- #Design-Based Slides
- #Operational Plan
- #Marketing Plan and Strategy
- #Diagram
- #Business Processes
- #Marketing Strategy
- #Flow
- #Circular Flow
- #16:9
- #circular diagram PowerPoint
- #4-stage cycle diagram
- #business process presentation
- #operational strategy slide
- #how to create cycle diagram in PowerPoint
About the Product
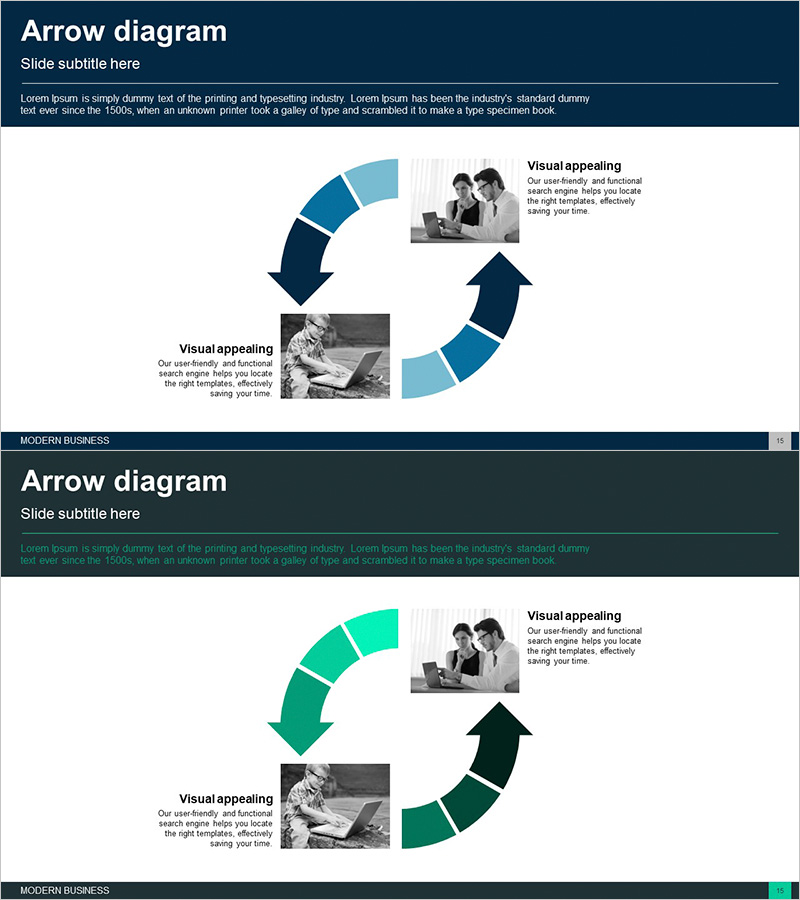
A PowerPoint slide that visualizes business operational processes in a 4-stage circular flow structure. The dark blue and light blue two-tone arrows clearly express each stage of progression, with dedicated spaces for images and text at each step. This diagram slide is ready to use immediately for presentations on business planning, marketing strategy, and operational management that require cyclical process explanation. The 2-slide set includes color variations (dark blue and green two-tone), allowing you to select designs that match your corporate brand identity.
Usage Points
-
Main Usage
Breaks down business operational processes into 4 stages and explains them visually. Effectively emphasizes the interconnection of each stage and continuous improvement cycles, clearly communicating the repetitive structure of planning, execution, evaluation, and improvement.
-
How to Use
Enter operational stage names (planning, execution, evaluation, improvement, etc.) into each arrow stage. Insert related photos or icons into the left image area, and write stage-specific descriptions in the right text boxes to complete the slide. Use the color variation slide to customize according to your corporate brand colors.
-
Recommended For
Recommended for business planning, operational strategy, marketing planning, quality management, and project management presentations. Useful for executives, team leaders, and project managers explaining organizational workflow cycles. Also applicable in training and seminars when presenting process improvement strategies.
-
Slide Structure
2-slide set. Each slide features a central 4-stage circular arrow (dark blue and light blue two-tone), two image input areas on the left, and two text boxes on the right. The first slide uses dark blue tones, and the second provides a green tone variation.
Related Products
-

Business Process Cycle Diagram – Effectively Communicating Operational Plans
#Operational Plan #Marketing Plan and Strategy #Diagram
-

Maple Leaf Circulation Work Process Slide - Core of Business
#Operational Plan #Diagram #Business Processes
-

Idea Circulation Diagram – Embracing Business Innovation
#Operational Plan #Technical Approach #Diagram
-

Circular Chart for Business Processes
#Operational Plan #Diagram #Business Processes
