Business Process Cycle Diagram – Effectively Communicating Operational Plans
RM0200012_18
- Last Update 02/04/2025
- File Size 0.7MB
- # of Slides 2
- File Format PPTX
- Slide Ratio 16:9
- Color
Keywords
- #Content-Based Slides
- #Design-Based Slides
- #Operational Plan
- #Marketing Plan and Strategy
- #Diagram
- #Business Processes
- #Marketing Strategy
- #Flow
- #Spread
- #Circular Flow
- #16:9
- #cycle diagram PowerPoint
- #6-stage circular flow slide
- #business process diagram
- #operational plan template
- #marketing strategy PowerPoint slide
About the Product
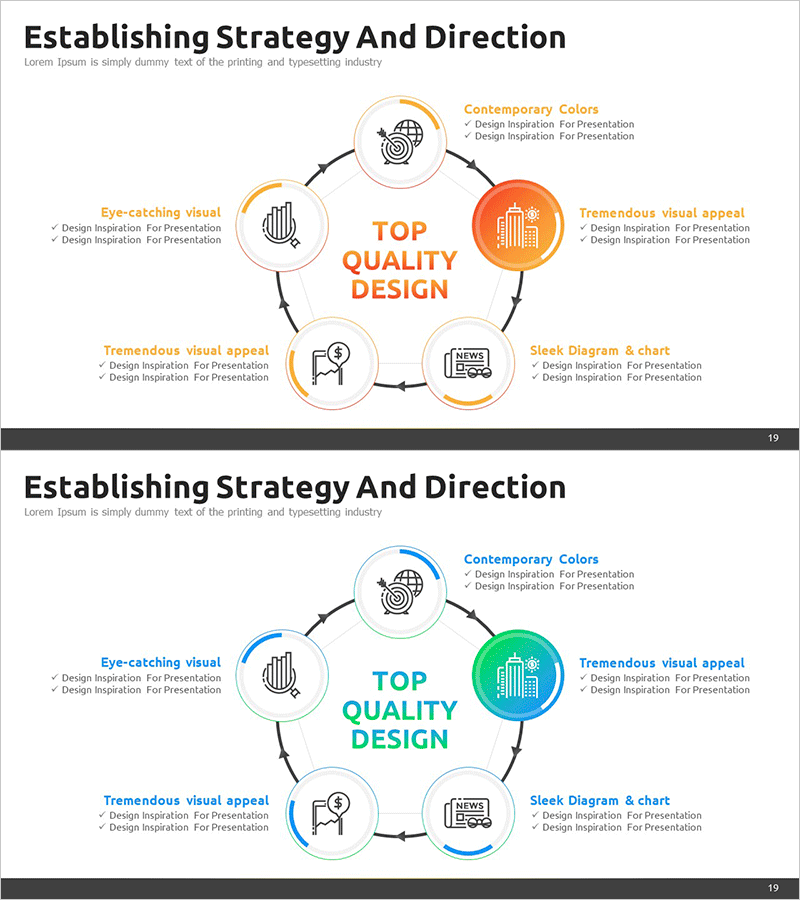
A PowerPoint slide that visualizes business processes and operational plans through a 6-stage circular flow structure. Six nodes arranged around a central message are connected by arrows, clearly conveying cyclical progression and iterative cycles. The orange and blue dual-tone color scheme distinguishes each stage, with icons and text areas positioned for immediate use in strategy presentations, marketing planning, and project management. The 2-slide set provides color variation options and is optimized for 16:9 widescreen format.
Usage Points
-
Main Usage
Clearly communicates cyclical business processes, iterative operational planning cycles, and phased marketing strategy progression. The 6-stage circular structure around a central message emphasizes strategic continuity and interdependencies.
-
How to Use
Enter stage names, descriptions, and responsibility information in each node's text area. Replace icons as needed to match your presentation context. Use the orange and blue color variations to represent different processes across sections.
-
Recommended For
Strategy and planning professionals, marketing teams, project managers, and operations leaders presenting business plans, marketing strategies, operational reports, and strategic initiatives requiring cyclical process visualization.
-
Slide Structure
Six nodes arranged in a circle around a central text box, each connected by arrows with icons and text areas. Slide 1 features orange tones and Slide 2 features blue tones, enabling multi-process representation with color differentiation.
Related Products
-

Strategies to Overcome Business Challenges – Utilizing a Radial Diagram
#Company Introduction #Marketing Plan and Strategy #Diagram
-

4P Strategy Cycle Diagram – Key to Marketing Success
#Business Vision and Strategy #Marketing Plan and Strategy #Diagram
-

Interactive Gear Flow Presentation Template – Simplifying Complex Business Strategies
#Operational Plan #Diagram #Business Processes
-

Game and Hobby Diagram – Visualizing Organization and Strategy
#Business Strategy #Operational Plan #Diagram
