Business Project Development Status Analysis Graph
RJ0300088_7
- Last Update 05/13/2025
- File Size 0.2MB
- # of Slides 2
- File Format PPTX
- Slide Ratio 16:9
- Color
Keywords
- #Content-Based Slides
- #Design-Based Slides
- #Product/Service Introduction
- #Business Introduction
- #Graph
- #Development Status
- #Technological Status
- #Circles
- #Doughnut Chart
- #16:9
- #donut chart PowerPoint slide
- #pie chart presentation template
- #ratio analysis slide
- #project progress visualization
- #circular graph template download
About the Product
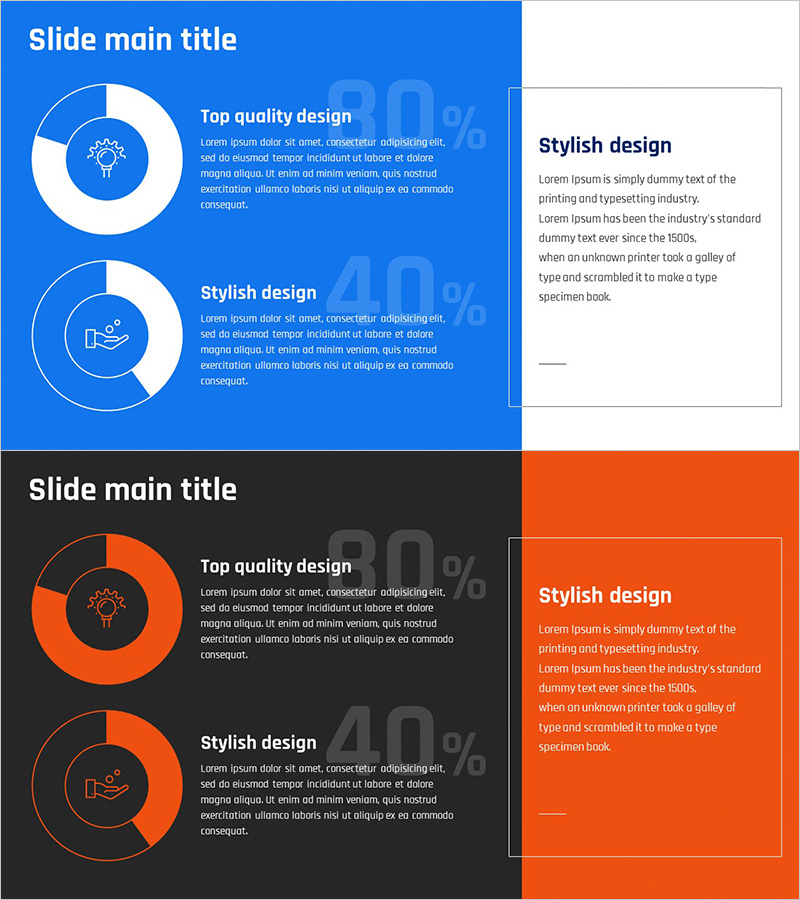
A donut chart PowerPoint slide set designed to visualize project development status and progress metrics. This 2-slide template features blue and orange color themes, with each slide combining a central icon and two-stage ratio data for clear visual representation. The donut chart places key percentages in the center, enabling instant data comprehension, while accompanying text areas allow for detailed descriptions. Ideal for presenting project completion rates, development phase progress, resource allocation status, and other ratio-based data in business presentations, reports, and stakeholder meetings.
Usage Points
-
Main Usage
Clearly present two-stage ratio data such as project development status, completion rates, resource allocation, and milestone achievement percentages using donut charts. The central icon and key metrics draw audience attention and enhance data comprehension during presentations.
-
How to Use
Input actual figures into the donut chart area and ratios automatically update. Fill in project names, development phases, and completion percentages in text boxes, then customize the central icon to match your project type. Choose between blue or orange color themes to align with your presentation style.
-
Recommended For
Project managers, development team leads, and business stakeholders presenting progress reports and communicating with stakeholders. Suitable for quarterly performance reviews, project kickoff meetings, investor presentations, and internal status update sessions.
-
Slide Structure
2-slide set with consistent layout: left side features a donut chart with central icon displaying two-stage ratio data; right side contains title and descriptive text areas. The donut chart uses concentric circles with center space for metrics or icons. Each slide applies different color schemes (blue or orange) for visual variety.
Related Products
-

Business Plan Presentation Template Pie Diagram – Effective Project Introduction
#Product/Service Introduction #Business Introduction #Graph
-

Big Data Development Status Analysis Graph – Visualizing Business Strategy
#Product/Service Introduction #Business Introduction #Diagram
-

Space Industry Development Status Graph – Capturing the Future of Industry
#Product/Service Introduction #Business Introduction #Graph
-

Analysis of Social Media Cloud Development Status – Stylish Donut Chart
#Product/Service Introduction #Business Introduction #Graph
