Space Industry Development Status Graph – Capturing the Future of Industry
RJ0700006_23
- Last Update 07/23/2025
- File Size 1.8MB
- # of Slides 2
- File Format PPTX
- Slide Ratio 16:9
- Color
Keywords
- #Content-Based Slides
- #Design-Based Slides
- #Product/Service Introduction
- #Business Introduction
- #Graph
- #Development Status
- #Technological Status
- #Circles
- #Doughnut Chart
- #16:9
- #donut chart PowerPoint slide
- #pie chart template
- #3-segment donut diagram
- #industry status graph
- #data visualization PowerPoint
- #how to create donut chart in PowerPoint
About the Product
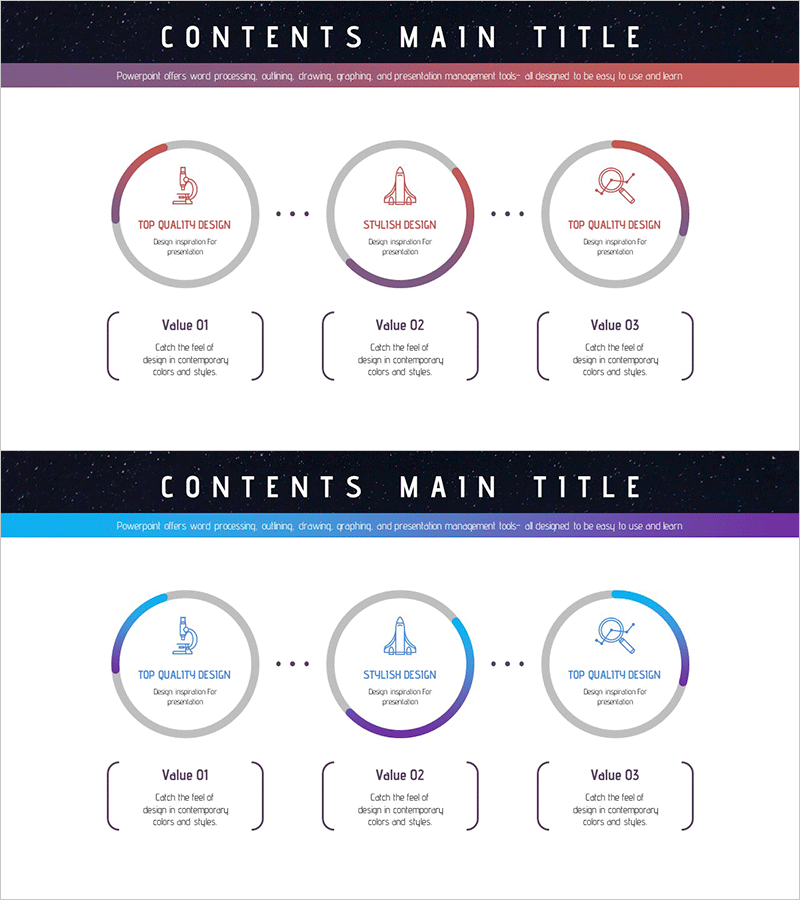
A donut chart PowerPoint slide that visualizes space industry development status across three segments. This presentation template combines a central icon with an outer circular chart to intuitively display proportional data. The design features gradient donut segments in purple, red, and gray tones with labeled text, making it ideal for industry analysis, business status presentations, and strategic planning materials. The 2-slide set enables flexible data representation and is ready for immediate editing and use in professional presentations.
Usage Points
-
Main Usage
Displays sectional and proportional data using a donut chart format, enabling viewers to understand overall composition and relative weight of each segment at a glance. Optimized for visualizing space industry development status, market share, business portfolio composition, and emerging technology sector performance.
-
How to Use
Enter industry name or topic in the central icon area and input item names and figures in the three outer segments. Freely edit colors, labels, and data values to integrate into company presentations, business reports, and strategic planning documents. The 16:9 widescreen format suits modern presentation standards.
-
Recommended For
Planners, analysts, and executives in emerging industries, space technology, and advanced technology sectors presenting market conditions, business portfolios, and divisional performance. Recommended for investor presentations, business plan pitches, industry analysis reports, and strategic planning meetings.
-
Slide Structure
2-slide set with each slide featuring a central icon (rocket, spacecraft, etc.) and an outer 3-segment donut chart. Gradient donut segments in purple, red, and gray tones with positioned labels and text boxes clearly represent segment proportions and item names.
Related Products
-

Business Analysis with Doughnut Chart – Dawn City Theme
#Product/Service Introduction #Business Introduction #Diagram
-

Visualizing Business Development Status with Donut Chart Slide
#Product/Service Introduction #Business Introduction #Graph
-

Typographic Wide Template Donut Chart – Visual Data Analysis
#Product/Service Introduction #Business Introduction #Graph
-

Visualizing Military Data with Donut Chart – Power of Trust
#Product/Service Introduction #Business Introduction #Diagram
