User Gender Ratio Analysis Graph – Data Visualization
RJ0300039_9
- Last Update 04/28/2025
- File Size 2.7MB
- # of Slides 2
- File Format PPTX
- Slide Ratio 16:9
- Color
Keywords
- #Content-Based Slides
- #Design-Based Slides
- #Market and Competitor Analysis
- #Graph
- #Customer Analysis
- #Market Analysis
- #Other
- #Other Charts
- #16:9
- #gender ratio infographic PowerPoint
- #demographic chart slide template
- #male female percentage visualization
- #data infographic slide design
- #silhouette icon chart
- #how to create gender ratio chart in PowerPoint
About the Product
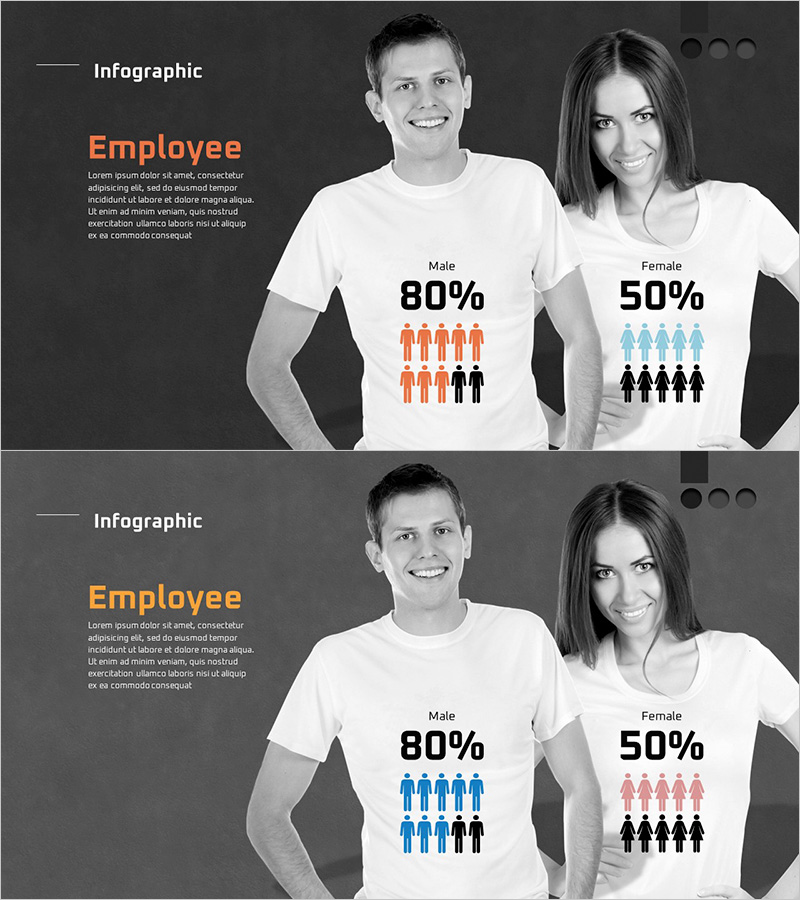
A data visualization PowerPoint slide that presents male and female ratio using silhouette icons. This infographic template features 10 human icons per category to display percentage distribution, with three color scheme options: orange, blue, and pink. The 2-slide set provides identical layouts with different color palettes, allowing you to match your presentation's visual identity. Perfect for employee demographics, customer analysis, market research, and gender-based data representation in business presentations, reports, and surveys.
Usage Points
-
Main Usage
Visualize gender distribution data using a clear infographic format with silhouette icons. The template displays male and female percentages side-by-side, with 10 icons per category representing the ratio. Ideal for HR presentations, customer demographic analysis, market research reports, census data, and any business context requiring gender-based data visualization.
-
How to Use
Edit the percentage values and icon count to match your actual data. Choose from three color schemes (orange, blue, or pink) based on your presentation's branding or section theme. All text labels and numerical values are fully editable. Simply replace the placeholder data with your own statistics.
-
Recommended For
HR and recruitment teams presenting employee composition, marketing teams analyzing customer demographics, market research reports, business plan presentations with target audience analysis, academic presentations explaining sample composition, corporate annual reports with demographic sections. Suitable for any presentation requiring clear gender-based data communication.
-
Slide Structure
2-slide set with identical layouts in different color schemes. Each slide features a left section with title and descriptive text, and a right section with two infographic areas. Each infographic uses 10 silhouette icons arranged horizontally, with filled and unfilled icons representing the percentage ratio. Clean, left-aligned text layout with ample white space.
Related Products
-

User Analysis Results Diagram - Infographic for Customer Insights
#Market and Competitor Analysis #Graph #Other
-

User Gender Ratio Analysis Graph – Essential Tool for Market and Customer Analysis
#Market and Competitor Analysis #Graph #Other
-

Medical Services Characteristics Connection Diagram
#Market and Competitor Analysis #Graph #Customer Analysis
-

Customer Analysis Diagram & Segmentation Graph – In-depth Market Insights
#Market and Competitor Analysis #Graph #Customer Analysis
